
Page 278 - Statistics for Environmental Engineers
P. 278
L1592_Frame_C31 Page 282 Tuesday, December 18, 2001 2:50 PM
This is the Pearson product-moment correlation coefficient, usually just called the correlation coefficient.
The range of r is from −1 to +1.
Case Study: Correlation of BOD and COD Measurements
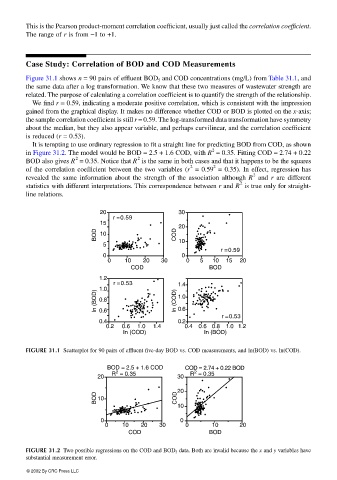
Figure 31.1 shows n = 90 pairs of effluent BOD 5 and COD concentrations (mg/L) from Table 31.1, and
the same data after a log transformation. We know that these two measures of wastewater strength are
related. The purpose of calculating a correlation coefficient is to quantify the strength of the relationship.
We find r = 0.59, indicating a moderate positive correlation, which is consistent with the impression
gained from the graphical display. It makes no difference whether COD or BOD is plotted on the x-axis;
the sample correlation coefficient is still r = 0.59. The log-transformed data transformation have symmetry
about the median, but they also appear variable, and perhaps curvilinear, and the correlation coefficient
is reduced (r = 0.53).
It is tempting to use ordinary regression to fit a straight line for predicting BOD from COD, as shown
2
in Figure 31.2. The model would be BOD = 2.5 + 1.6 COD, with R = 0.35. Fitting COD = 2.74 + 0.22
2 2
BOD also gives R = 0.35. Notice that R is the same in both cases and that it happens to be the squares
2
2
of the correlation coefficient between the two variables (r = 0.59 = 0.35). In effect, regression has
2
revealed the same information about the strength of the association although R and r are different
2
statistics with different interpretations. This correspondence between r and R is true only for straight-
line relations.
20 30
r = 0.59
15
BOD 10 COD 20
5 10
r = 0.59
0 0
0 10 20 30 0 5 10 15 20
COD BOD
1.2
r = 0.53 1.4
In (BOD) 1.0 In (COD) 1.0
0.8
0.6
0.6
r = 0.53
0.4 0.2
0.2 0.6 1.0 1.4 0.4 0.6 0.8 1.0 1.2
In (COD) In (BOD)
FIGURE 31.1 Scatterplot for 90 pairs of effluent five-day BOD vs. COD measurements, and ln(BOD) vs. ln(COD).
BOD = 2.5 + 1.6 COD COD = 2.74 + 0.22 BOD
2
2
R = 0.35 R = 0.35
20 30
BOD 10 COD 20
10
0 0
0 10 20 30 0 10 20
COD BOD
FIGURE 31.2 Two possible regressions on the COD and BOD 5 data. Both are invalid because the x and y variables have
substantial measurement error.
© 2002 By CRC Press LLC