
Page 283 - Statistics for Environmental Engineers
P. 283
L1592_Frame_C31 Page 287 Tuesday, December 18, 2001 2:50 PM
31.4 Rounding. Express the data in Exercise 31.3 as thousands, rounded to one decimal place, and
recalculate the correlation; that is, the Jan. 1999 BOD becomes 68.3.
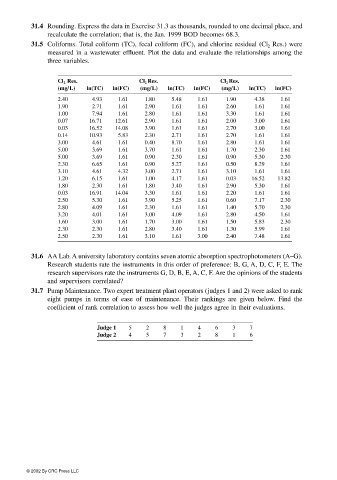
31.5 Coliforms. Total coliform (TC), fecal coliform (FC), and chlorine residual (Cl 2 Res.) were
measured in a wastewater effluent. Plot the data and evaluate the relationships among the
three variables.
Cl 2 Res. Cl 2 Res. Cl 2 Res.
(mg/L) ln(TC) ln(FC) (mg/L) ln(TC) ln(FC) (mg/L) ln(TC) ln(FC)
2.40 4.93 1.61 1.80 5.48 1.61 1.90 4.38 1.61
1.90 2.71 1.61 2.90 1.61 1.61 2.60 1.61 1.61
1.00 7.94 1.61 2.80 1.61 1.61 3.30 1.61 1.61
0.07 16.71 12.61 2.90 1.61 1.61 2.00 3.00 1.61
0.03 16.52 14.08 3.90 1.61 1.61 2.70 3.00 1.61
0.14 10.93 5.83 2.30 2.71 1.61 2.70 1.61 1.61
3.00 4.61 1.61 0.40 8.70 1.61 2.80 1.61 1.61
5.00 3.69 1.61 3.70 1.61 1.61 1.70 2.30 1.61
5.00 3.69 1.61 0.90 2.30 1.61 0.90 5.30 2.30
2.30 6.65 1.61 0.90 5.27 1.61 0.50 8.29 1.61
3.10 4.61 4.32 3.00 2.71 1.61 3.10 1.61 1.61
1.20 6.15 1.61 1.00 4.17 1.61 0.03 16.52 13.82
1.80 2.30 1.61 1.80 3.40 1.61 2.90 5.30 1.61
0.03 16.91 14.04 3.30 1.61 1.61 2.20 1.61 1.61
2.50 5.30 1.61 3.90 5.25 1.61 0.60 7.17 2.30
2.80 4.09 1.61 2.30 1.61 1.61 1.40 5.70 2.30
3.20 4.01 1.61 3.00 4.09 1.61 2.80 4.50 1.61
1.60 3.00 1.61 1.70 3.00 1.61 1.50 5.83 2.30
2.30 2.30 1.61 2.80 3.40 1.61 1.30 5.99 1.61
2.50 2.30 1.61 3.10 1.61 3.00 2.40 7.48 1.61
31.6 AA Lab. A university laboratory contains seven atomic absorption spectrophotometers (A–G).
Research students rate the instruments in this order of preference: B, G, A, D, C, F, E. The
research supervisors rate the instruments G, D, B, E, A, C, F. Are the opinions of the students
and supervisors correlated?
31.7 Pump Maintenance. Two expert treatment plant operators (judges 1 and 2) were asked to rank
eight pumps in terms of ease of maintenance. Their rankings are given below. Find the
coefficient of rank correlation to assess how well the judges agree in their evaluations.
Judge 1 5 2 8 1 4 6 3 7
Judge 2 4 5 7 3 2 8 1 6
© 2002 By CRC Press LLC