Page 282 - Statistics for Environmental Engineers
P. 282

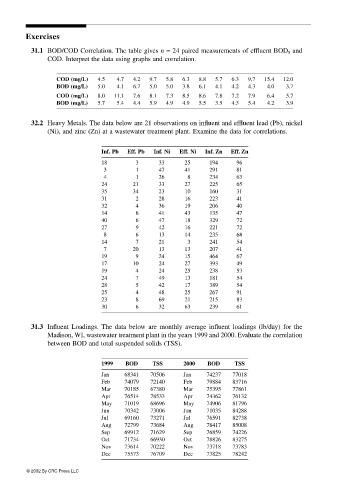
L1592_Frame_C31  Page 286  Tuesday, December 18, 2001  2:50 PM


                       Exercises
                        31.1 BOD/COD Correlation. The table gives n = 24 paired measurements of effluent BOD 5  and
                             COD. Interpret the data using graphs and correlation.

                               COD (mg/L)  4.5  4.7  4.2  9.7  5.8  6.3  8.8  5.7  6.3  9.7  15.4  12.0
                               BOD (mg/L)  5.0  4.1  6.7  5.0  5.0  3.8  6.1  4.1  4.2  4.3  4.0  3.7
                               COD (mg/L)  8.0  11.1  7.6  8.1  7.3  8.5  8.6  7.8  7.2  7.9  6.4  5.7
                               BOD (mg/L)  5.7  5.4  4.4  5.9  4.9  4.9  5.5  3.5  4.3  5.4  4.2  3.9


                        32.2 Heavy Metals. The data below are 21 observations on influent and effluent lead (Pb), nickel
                             (Ni), and zinc (Zn) at a wastewater treatment plant. Examine the data for correlations.


                                            Inf. Pb  Eff. Pb  Inf. Ni  Eff. Ni  Inf. Zn  Eff. Zn
                                            18       3      33     25     194    96
                                            3        1      47     41     291    81
                                            4        1      26      8     234    63
                                            24      21      33     27     225    65
                                            35      34      23     10     160    31
                                            31       2      28     16     223    41
                                            32       4      36     19     206    40
                                            14       6      41     43     135    47
                                            40       6      47     18     329    72
                                            27       9      42     16     221    72
                                            8        6      13     14     235    68
                                            14       7      21      3     241    54
                                            7       20      13     13     207    41
                                            19       9      24     15     464    67
                                            17      10      24     27     393    49
                                            19       4      24     25     238    53
                                            24       7      49     13     181    54
                                            28       5      42     17     389    54
                                            25       4      48     25     267    91
                                            23       8      69     21     215    83
                                            30       6      32     63     239    61

                        31.3 Influent Loadings. The data below are monthly average influent loadings (lb/day) for the
                             Madison, WI, wastewater treatment plant in the years 1999 and 2000. Evaluate the correlation
                             between BOD and total suspended solids (TSS).


                                            1999  BOD     TSS     2000   BOD     TSS
                                            Jan   68341  70506    Jan    74237  77018
                                            Feb   74079  72140    Feb    79884  83716
                                            Mar   70185  67380    Mar    75395  77861
                                            Apr   76514  78533    Apr    74362  76132
                                            May   71019  68696    May    74906  81796
                                            Jun   70342  73006    Jun    71035  84288
                                            Jul   69160  73271    Jul    76591  82738
                                            Aug   72799  73684    Aug    78417  85008
                                            Sep   69912  71629    Sep    76859  74226
                                            Oct   71734  66930    Oct    78826  83275
                                            Nov   73614  70222    Nov    73718  73783
                                            Dec   75573  76709    Dec    73825  78242

                       © 2002 By CRC Press LLC
   277   278   279   280   281   282   283   284   285   286   287