
Page 281 - Statistics for Environmental Engineers
P. 281
L1592_Frame_C31 Page 285 Tuesday, December 18, 2001 2:50 PM
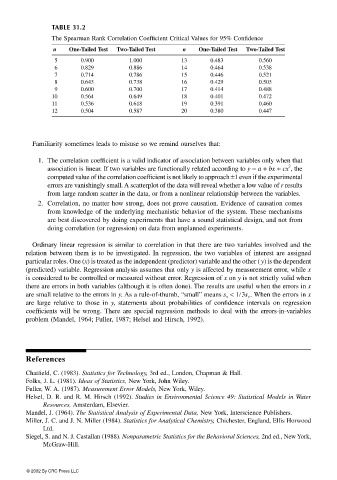
TABLE 31.2
The Spearman Rank Correlation Coefficient Critical Values for 95% Confidence
n One-Tailed Test Two-Tailed Test n One-Tailed Test Two-Tailed Test
5 0.900 1.000 13 0.483 0.560
6 0.829 0.886 14 0.464 0.538
7 0.714 0.786 15 0.446 0.521
8 0.643 0.738 16 0.429 0.503
9 0.600 0.700 17 0.414 0.488
10 0.564 0.649 18 0.401 0.472
11 0.536 0.618 19 0.391 0.460
12 0.504 0.587 20 0.380 0.447
Familiarity sometimes leads to misuse so we remind ourselves that:
1. The correlation coefficient is a valid indicator of association between variables only when that
2
association is linear. If two variables are functionally related according to y = a + bx + cx , the
computed value of the correlation coefficient is not likely to approach ±1 even if the experimental
errors are vanishingly small. A scatterplot of the data will reveal whether a low value of r results
from large random scatter in the data, or from a nonlinear relationship between the variables.
2. Correlation, no matter how strong, does not prove causation. Evidence of causation comes
from knowledge of the underlying mechanistic behavior of the system. These mechanisms
are best discovered by doing experiments that have a sound statistical design, and not from
doing correlation (or regression) on data from unplanned experiments.
Ordinary linear regression is similar to correlation in that there are two variables involved and the
relation between them is to be investigated. In regression, the two variables of interest are assigned
particular roles. One (x) is treated as the independent (predictor) variable and the other ( y) is the dependent
(predicted) variable. Regression analysis assumes that only y is affected by measurement error, while x
is considered to be controlled or measured without error. Regression of x on y is not strictly valid when
there are errors in both variables (although it is often done). The results are useful when the errors in x
are small relative to the errors in y. As a rule-of-thumb, “small” means s x < 1/3s y . When the errors in x
are large relative to those in y, statements about probabilities of confidence intervals on regression
coefficients will be wrong. There are special regression methods to deal with the errors-in-variables
problem (Mandel, 1964; Fuller, 1987; Helsel and Hirsch, 1992).
References
Chatfield, C. (1983). Statistics for Technology, 3rd ed., London, Chapman & Hall.
Folks, J. L. (1981). Ideas of Statistics, New York, John Wiley.
Fuller, W. A. (1987). Measurement Error Models, New York, Wiley.
Helsel, D. R. and R. M. Hirsch (1992). Studies in Environmental Science 49: Statistical Models in Water
Resources, Amsterdam, Elsevier.
Mandel, J. (1964). The Statistical Analysis of Experimental Data, New York, Interscience Publishers.
Miller, J. C. and J. N. Miller (1984). Statistics for Analytical Chemistry, Chichester, England, Ellis Horwood
Ltd.
Siegel, S. and N. J. Castallan (1988). Nonparametric Statistics for the Behavioral Sciences, 2nd ed., New York,
McGraw-Hill.
© 2002 By CRC Press LLC