
Page 279 - Statistics for Environmental Engineers
P. 279
L1592_Frame_C31 Page 283 Tuesday, December 18, 2001 2:50 PM
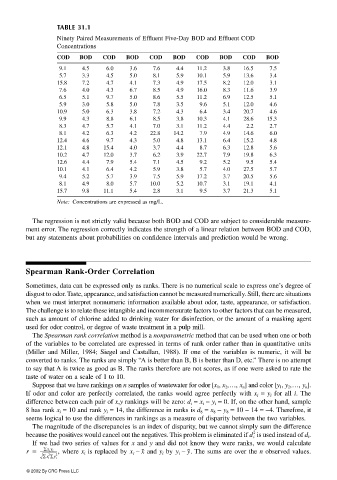
TABLE 31.1
Ninety Paired Measurements of Effluent Five-Day BOD and Effluent COD
Concentrations
COD BOD COD BOD COD BOD COD BOD COD BOD
9.1 4.5 6.0 3.6 7.6 4.4 11.2 3.8 16.5 7.5
5.7 3.3 4.5 5.0 8.1 5.9 10.1 5.9 13.6 3.4
15.8 7.2 4.7 4.1 7.3 4.9 17.5 8.2 12.0 3.1
7.6 4.0 4.3 6.7 8.5 4.9 16.0 8.3 11.6 3.9
6.5 5.1 9.7 5.0 8.6 5.5 11.2 6.9 12.5 5.1
5.9 3.0 5.8 5.0 7.8 3.5 9.6 5.1 12.0 4.6
10.9 5.0 6.3 3.8 7.2 4.3 6.4 3.4 20.7 4.6
9.9 4.3 8.8 6.1 8.5 3.8 10.3 4.1 28.6 15.3
8.3 4.7 5.7 4.1 7.0 3.1 11.2 4.4 2.2 2.7
8.1 4.2 6.3 4.2 22.8 14.2 7.9 4.9 14.6 6.0
12.4 4.6 9.7 4.3 5.0 4.8 13.1 6.4 15.2 4.8
12.1 4.8 15.4 4.0 3.7 4.4 8.7 6.3 12.8 5.6
10.2 4.7 12.0 3.7 6.2 3.9 22.7 7.9 19.8 6.3
12.6 4.4 7.9 5.4 7.1 4.5 9.2 5.2 9.5 5.4
10.1 4.1 6.4 4.2 5.9 3.8 5.7 4.0 27.5 5.7
9.4 5.2 5.7 3.9 7.5 5.9 17.2 3.7 20.5 5.6
8.1 4.9 8.0 5.7 10.0 5.2 10.7 3.1 19.1 4.1
15.7 9.8 11.1 5.4 2.8 3.1 9.5 3.7 21.3 5.1
Note: Concentrations are expressed as mg/L.
The regression is not strictly valid because both BOD and COD are subject to considerable measure-
ment error. The regression correctly indicates the strength of a linear relation between BOD and COD,
but any statements about probabilities on confidence intervals and prediction would be wrong.
Spearman Rank-Order Correlation
Sometimes, data can be expressed only as ranks. There is no numerical scale to express one’s degree of
disgust to odor. Taste, appearance, and satisfaction cannot be measured numerically. Still, there are situations
when we must interpret nonnumeric information available about odor, taste, appearance, or satisfaction.
The challenge is to relate these intangible and incommensurate factors to other factors that can be measured,
such as amount of chlorine added to drinking water for disinfection, or the amount of a masking agent
used for odor control, or degree of waste treatment in a pulp mill.
The Spearman rank correlation method is a nonparametric method that can be used when one or both
of the variables to be correlated are expressed in terms of rank order rather than in quantitative units
(Miller and Miller, 1984; Siegel and Castallan, 1988). If one of the variables is numeric, it will be
converted to ranks. The ranks are simply “A is better than B, B is better than D, etc.” There is no attempt
to say that A is twice as good as B. The ranks therefore are not scores, as if one were asked to rate the
taste of water on a scale of 1 to 10.
Suppose that we have rankings on n samples of wastewater for odor [x 1 , x 2 ,…, x n ] and color [y 1 , y 2 ,…, y n ].
If odor and color are perfectly correlated, the ranks would agree perfectly with x i = y i for all i. The
difference between each pair of x,y rankings will be zero: d i = x i − y i = 0. If, on the other hand, sample
8 has rank x i = 10 and rank y i = 14, the difference in ranks is d 8 = x 8 − y 8 = 10 − 14 = −4. Therefore, it
seems logical to use the differences in rankings as a measure of disparity between the two variables.
The magnitude of the discrepancies is an index of disparity, but we cannot simply sum the difference
2
because the positives would cancel out the negatives. This problem is eliminated if is used instead of d i .d i
If we had two series of values for x and y and did not know they were ranks, we would calculate
r = ------------------------ , where x i is replaced by x i – x and y i by y i – y. The sums are over the n observed values.
∑x i y i
2 2
∑x i ∑y i
© 2002 By CRC Press LLC