Page 276 - Statistics for Environmental Engineers
P. 276

L1592_Frame_C30  Page 279  Tuesday, December 18, 2001  2:49 PM


                                                                        y       ln( y)
                                            X 1      X 2     X 3
                                            −1       1       −1        1.88     0.631
                                            −1       −1      −1        2.1      0.742
                                            −1       1        1        6.1      1.808
                                            −1       −1       1        6.4      1.856
                                             1       −1      −1       16        2.773
                                             1       1       −1       17        2.833
                                             1       −1       1       19        2.944
                                             1       1        1       19.5      2.970
                                             0       0        0       10.1      2.313
                                             0       0        0       10.1      2.313
                                             0       0        0       10.5      2.351
                                             0       0        0       10.9      2.389
                                            Note: X 1  is the type of wastewater:
                                                              −1 = influent  +1 = effluent
                                                 X 2  is preservative:  −1 = none  +1 = added
                                                 X 3  is method:  −1 = Method A  +1 = Method B

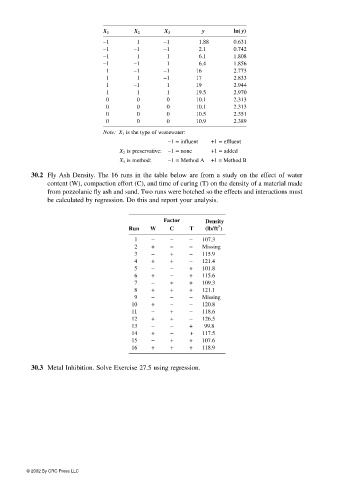
                        30.2  Fly Ash Density. The 16 runs in the table below are from a study on the effect of water
                             content (W), compaction effort (C), and time of curing (T) on the density of a material made
                             from pozzolanic fly ash and sand. Two runs were botched so the effects and interactions must
                             be calculated by regression. Do this and report your analysis.


                                                             Factor      Density
                                                                            3
                                                   Run   W     C    T   (lb/ft )
                                                     1   −     −    −   107.3
                                                     2   +     −    −   Missing
                                                     3   −     +    −   115.9
                                                     4   +     +    −   121.4
                                                     5   −     −    +   101.8
                                                     6   +     −    +   115.6
                                                     7   −     +    +   109.3
                                                     8   +     +    +   121.1
                                                     9   −     −    −   Missing
                                                    10   +     −    −   120.8
                                                    11   −     +    −   118.6
                                                    12   +     +    −   126.5
                                                    13   −     −    +    99.8
                                                    14   +     −    +   117.5
                                                    15   −     +    +   107.6
                                                    16   +     +    +   118.9

                        30.3 Metal Inhibition. Solve Exercise 27.5 using regression.


                       © 2002 By CRC Press LLC
   271   272   273   274   275   276   277   278   279   280   281