
Page 280 - Statistics for Environmental Engineers
P. 280
L1592_Frame_C31 Page 284 Tuesday, December 18, 2001 2:50 PM
2
2
Knowing that the data are rankings, we can simplify this using d i = ( x i – ) , which gives
y i
x i y i = --- x i +( 2 y i – d i ) and:
2
2
1
2
∑ x i + y i – d i ) ∑x i + ∑y i – 2
(
2
2
2
2
2
r S = ------------------------------------ = -----------------------------------------
∑d i
2 2 2 2
2 ∑x i ∑y i 2 ∑x i ∑y i
The above equation can be used even when there are tied ranks. If there are no ties, then ∑x i = ∑y i =
2
2
nn –( 2 1)/12 and:
2
r S = 1 – ----------------------
6∑d i
(
2
nn – 1)
The subscript S indicates the Spearman rank-order correlation coefficient. Like the Pearson product-
moment correlation coefficient, r S can vary between −1 and +1.
Case Study: Taste and Odor
Drinking water is treated with seven concentrations of a chemical to improve taste and reduce odor. The
taste and odor resulting from the seven treatments could not be measured quantitatively, but consumers
could express their opinions by ranking them. The consumer ranking produced the following data, where
rank 1 is the most acceptable and rank 7 is the least acceptable.
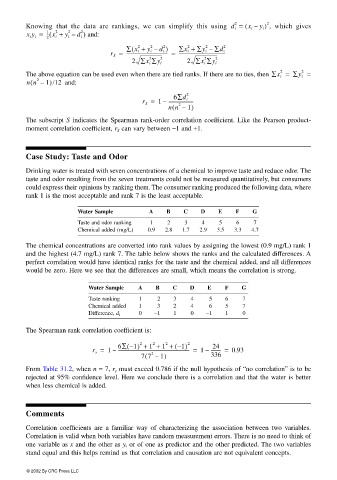
Water Sample A B C D E F G
Taste and odor ranking 1 2 3 4 5 6 7
Chemical added (mg/L) 0.9 2.8 1.7 2.9 3.5 3.3 4.7
The chemical concentrations are converted into rank values by assigning the lowest (0.9 mg/L) rank 1
and the highest (4.7 mg/L) rank 7. The table below shows the ranks and the calculated differences. A
perfect correlation would have identical ranks for the taste and the chemical added, and all differences
would be zero. Here we see that the differences are small, which means the correlation is strong.
Water Sample A B C D E F G
Taste ranking 1 2 3 4 5 6 7
Chemical added 1 3 2 4 6 5 7
0 −1 1 0 −1 1 0
Difference, d i
The Spearman rank correlation coefficient is:
(
6∑ 1) + 1 + 1 + – ( 1) 2 24
2
2
2
–
r s = 1 – --------------------------------------------------------------- = 1 – --------- = 0.93
77 –( 2 1) 336
From Table 31.2, when n = 7, r s must exceed 0.786 if the null hypothesis of “no correlation” is to be
rejected at 95% confidence level. Here we conclude there is a correlation and that the water is better
when less chemical is added.
Comments
Correlation coefficients are a familiar way of characterizing the association between two variables.
Correlation is valid when both variables have random measurement errors. There is no need to think of
one variable as x and the other as y, or of one as predictor and the other predicted. The two variables
stand equal and this helps remind us that correlation and causation are not equivalent concepts.
© 2002 By CRC Press LLC