
Page 359 - Statistics for Environmental Engineers
P. 359
L1592_Frame_C41 Page 369 Tuesday, December 18, 2001 3:24 PM
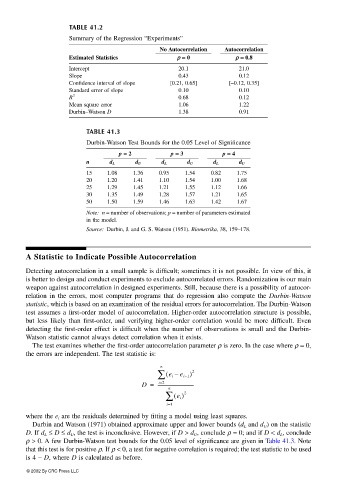
TABLE 41.2
Summary of the Regression “Experiments”
No Autocorrelation Autocorrelation
Estimated Statistics ρρ ρρ == == 0 ρρ ρρ == == 0.8
Intercept 20.1 21.0
Slope 0.43 0.12
Confidence interval of slope [0.21, 0.65] [–0.12, 0.35]
Standard error of slope 0.10 0.10
R 2 0.68 0.12
Mean square error 1.06 1.22
Durbin–Watson D 1.38 0.91
TABLE 41.3
Durbin-Watson Test Bounds for the 0.05 Level of Significance
p == == 2 p == == 3 p == == 4
n d L d U d L d U d L d U
15 1.08 1.36 0.95 1.54 0.82 1.75
20 1.20 1.41 1.10 1.54 1.00 1.68
25 1.29 1.45 1.21 1.55 1.12 1.66
30 1.35 1.49 1.28 1.57 1.21 1.65
50 1.50 1.59 1.46 1.63 1.42 1.67
Note: n = number of observations; p = number of parameters estimated
in the model.
Source: Durbin, J. and G. S. Watson (1951). Biometrika, 38, 159–178.
A Statistic to Indicate Possible Autocorrelation
Detecting autocorrelation in a small sample is difficult; sometimes it is not possible. In view of this, it
is better to design and conduct experiments to exclude autocorrelated errors. Randomization is our main
weapon against autocorrelation in designed experiments. Still, because there is a possibility of autocor-
relation in the errors, most computer programs that do regression also compute the Durbin-Watson
statistic, which is based on an examination of the residual errors for autocorrelation. The Durbin-Watson
test assumes a first-order model of autocorrelation. Higher-order autocorrelation structure is possible,
but less likely than first-order, and verifying higher-order correlation would be more difficult. Even
detecting the first-order effect is difficult when the number of observations is small and the Durbin-
Watson statistic cannot always detect correlation when it exists.
The test examines whether the first-order autocorrelation parameter ρ is zero. In the case where ρ = 0,
the errors are independent. The test statistic is:
n
∑ ( e i – e i−1 ) 2
i=2
D = --------------------------------
n
∑ () 2
e i
i=1
where the e i are the residuals determined by fitting a model using least squares.
Durbin and Watson (1971) obtained approximate upper and lower bounds (d L and d U ) on the statistic
D. If d L ≤ D ≤ d U , the test is inconclusive. However, if D > d U , conclude ρ = 0; and if D < d L , conclude
ρ > 0. A few Durbin-Watson test bounds for the 0.05 level of significance are given in Table 41.3. Note
that this test is for positive ρ. If ρ < 0, a test for negative correlation is required; the test statistic to be used
is 4 − D, where D is calculated as before.
© 2002 By CRC Press LLC