
Page 354 - Statistics for Environmental Engineers
P. 354
L1592_frame_C40 Page 364 Tuesday, December 18, 2001 3:24 PM
x 2.5 22 60 90 105 144 178 210 233 256 300 400
y 16.6 15.3 16.9 16.1 17.1 16.9 18.6 19.3 25.8 28.4 35.5 45.3
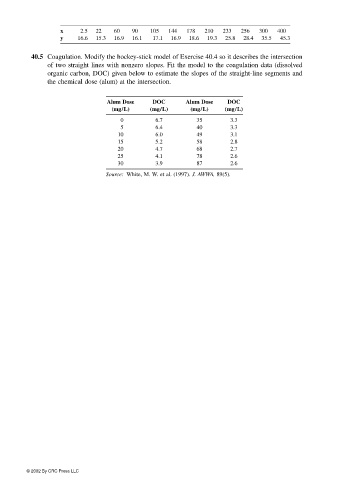
40.5 Coagulation. Modify the hockey-stick model of Exercise 40.4 so it describes the intersection
of two straight lines with nonzero slopes. Fit the model to the coagulation data (dissolved
organic carbon, DOC) given below to estimate the slopes of the straight-line segments and
the chemical dose (alum) at the intersection.
Alum Dose DOC Alum Dose DOC
(mg/L) (mg/L) (mg/L) (mg/L)
0 6.7 35 3.3
5 6.4 40 3.3
10 6.0 49 3.1
15 5.2 58 2.8
20 4.7 68 2.7
25 4.1 78 2.6
30 3.9 87 2.6
Source: White, M. W. et al. (1997). J. AWWA, 89(5).
© 2002 By CRC Press LLC