Page 352 - Statistics for Environmental Engineers
P. 352

L1592_frame_C40   Page 362  Tuesday, December 18, 2001  3:24 PM


                       Exercises
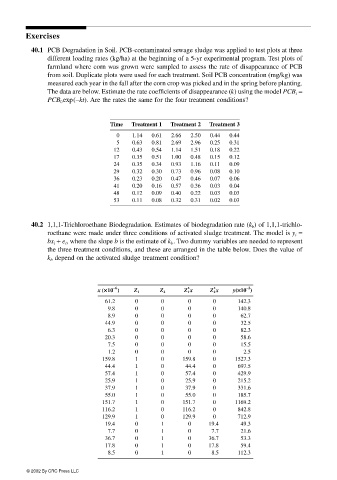
                        40.1 PCB Degradation in Soil. PCB-contaminated sewage sludge was applied to test plots at three
                             different loading rates (kg/ha) at the beginning of a 5-yr experimental program. Test plots of
                             farmland where corn was grown were sampled to assess the rate of disappearance of PCB
                             from soil. Duplicate plots were used for each treatment. Soil PCB concentration (mg/kg) was
                             measured each year in the fall after the corn crop was picked and in the spring before planting.
                             The data are below. Estimate the rate coefficients of disappearance (k) using the model PCB t  =
                             PCB 0 exp(−kt). Are the rates the same for the four treatment conditions?


                                              Time  Treatment 1  Treatment 2  Treatment 3
                                                0   1.14  0.61  2.66  2.50  0.44  0.44
                                                5   0.63  0.81  2.69  2.96  0.25  0.31
                                               12   0.43  0.54  1.14  1.51  0.18  0.22
                                               17   0.35  0.51  1.00  0.48  0.15  0.12
                                               24   0.35  0.34  0.93  1.16  0.11  0.09
                                               29   0.32  0.30  0.73  0.96  0.08  0.10
                                               36   0.23  0.20  0.47  0.46  0.07  0.06
                                               41   0.20  0.16  0.57  0.36  0.03  0.04
                                               48   0.12  0.09  0.40  0.22  0.03  0.03
                                               53   0.11  0.08  0.32  0.31  0.02  0.03


                        40.2 1,1,1-Trichloroethane Biodegradation. Estimates of biodegradation rate (k b ) of 1,1,1-trichlo-
                             roethane were made under three conditions of activated sludge treatment. The model is y i  =
                             bx i  + e i , where the slope b is the estimate of k b . Two dummy variables are needed to represent
                             the three treatment conditions, and these are arranged in the table below. Does the value of
                             k b  depend on the activated sludge treatment condition?


                                               −− − −6              ∗∗ ∗ ∗  ∗∗ ∗ ∗  −− − −3
                                           x (×× ××10 )  Z 1  Z 2  Z 1 x  Z 2 x  y(×× ××10 )
                                             61.2    0      0       0      0     142.3
                                             9.8     0      0       0      0     140.8
                                             8.9     0      0       0      0      62.7
                                             44.9    0      0       0      0      32.5
                                             6.3     0      0       0      0      82.3
                                             20.3    0      0       0      0      58.6
                                             7.5     0      0       0      0      15.5
                                             1.2     0      0       0      0       2.5
                                            159.8    1      0     159.8    0     1527.3
                                             44.4    1      0      44.4    0     697.5
                                             57.4    1      0      57.4    0     429.9
                                             25.9    1      0      25.9    0     215.2
                                             37.9    1      0      37.9    0     331.6
                                             55.0    1      0      55.0    0     185.7
                                            151.7    1      0     151.7    0     1169.2
                                            116.2    1      0     116.2    0     842.8
                                            129.9    1      0     129.9    0     712.9
                                             19.4    0      1       0    19.4     49.3
                                             7.7     0      1       0     7.7     21.6
                                             36.7    0      1       0    36.7     53.3
                                             17.8    0      1       0    17.8     59.4
                                             8.5     0      1       0     8.5    112.3

                       © 2002 By CRC Press LLC
   347   348   349   350   351   352   353   354   355   356   357