
Page 349 - Statistics for Environmental Engineers
P. 349
L1592_frame_C40 Page 359 Tuesday, December 18, 2001 3:24 PM
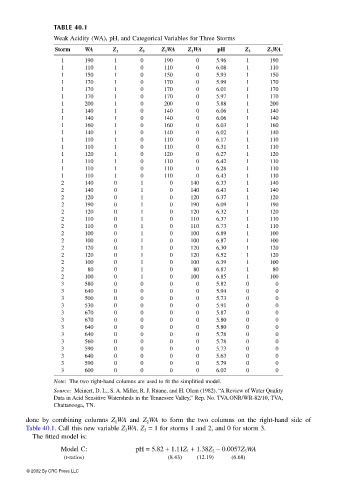
TABLE 40.1
Weak Acidity (WA), pH, and Categorical Variables for Three Storms
Storm WA Z 1 Z 2 Z 1 WA Z 2 WA pH Z 3 Z 3 WA
1 190 1 0 190 0 5.96 1 190
1 110 1 0 110 0 6.08 1 110
1 150 1 0 150 0 5.93 1 150
1 170 1 0 170 0 5.99 1 170
1 170 1 0 170 0 6.01 1 170
1 170 1 0 170 0 5.97 1 170
1 200 1 0 200 0 5.88 1 200
1 140 1 0 140 0 6.06 1 140
1 140 1 0 140 0 6.06 1 140
1 160 1 0 160 0 6.03 1 160
1 140 1 0 140 0 6.02 1 140
1 110 1 0 110 0 6.17 1 110
1 110 1 0 110 0 6.31 1 110
1 120 1 0 120 0 6.27 1 120
1 110 1 0 110 0 6.42 1 110
1 110 1 0 110 0 6.28 1 110
1 110 1 0 110 0 6.43 1 110
2 140 0 1 0 140 6.33 1 140
2 140 0 1 0 140 6.43 1 140
2 120 0 1 0 120 6.37 1 120
2 190 0 1 0 190 6.09 1 190
2 120 0 1 0 120 6.32 1 120
2 110 0 1 0 110 6.37 1 110
2 110 0 1 0 110 6.73 1 110
2 100 0 1 0 100 6.89 1 100
2 100 0 1 0 100 6.87 1 100
2 120 0 1 0 120 6.30 1 120
2 120 0 1 0 120 6.52 1 120
2 100 0 1 0 100 6.39 1 100
2 80 0 1 0 80 6.87 1 80
2 100 0 1 0 100 6.85 1 100
3 580 0 0 0 0 5.82 0 0
3 640 0 0 0 0 5.94 0 0
3 500 0 0 0 0 5.73 0 0
3 530 0 0 0 0 5.91 0 0
3 670 0 0 0 0 5.87 0 0
3 670 0 0 0 0 5.80 0 0
3 640 0 0 0 0 5.80 0 0
3 640 0 0 0 0 5.78 0 0
3 560 0 0 0 0 5.78 0 0
3 590 0 0 0 0 5.73 0 0
3 640 0 0 0 0 5.63 0 0
3 590 0 0 0 0 5.79 0 0
3 600 0 0 0 0 6.02 0 0
Note: The two right-hand columns are used to fit the simplified model.
Source: Meinert, D. L., S. A. Miller, R. J. Ruane, and H. Olem (1982). “A Review of Water Quality
Data in Acid Sensitive Watersheds in the Tennessee Valley,” Rep. No. TVA.ONR/WR-82/10, TVA,
Chattanooga, TN.
done by combining columns Z 1 WA and Z 2 WA to form the two columns on the right-hand side of
Table 40.1. Call this new variable Z 3 WA. Z 3 = 1 for storms 1 and 2, and 0 for storm 3.
The fitted model is:
Model C: pH = 5.82 + 1.11Z 1 + 1.38Z 2 − 0.0057Z 3 WA
(t-ratios) (8.43) (12.19) (6.68)
© 2002 By CRC Press LLC