
Page 353 - Statistics for Environmental Engineers
P. 353
L1592_frame_C40 Page 363 Tuesday, December 18, 2001 3:24 PM
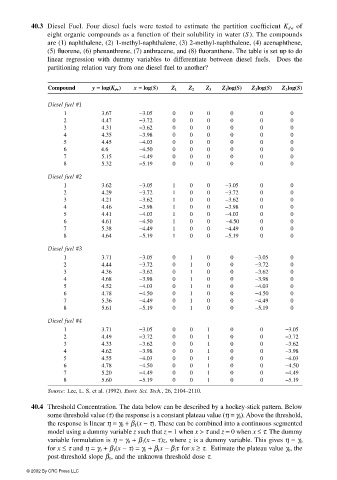
40.3 Diesel Fuel. Four diesel fuels were tested to estimate the partition coefficient K dw of
eight organic compounds as a function of their solubility in water (S). The compounds
are (1) naphthalene, (2) 1-methyl-naphthalene, (3) 2-methyl-naphthalene, (4) acenaphthene,
(5) fluorene, (6) phenanthrene, (7) anthracene, and (8) fluoranthene. The table is set up to do
linear regression with dummy variables to differentiate between diesel fuels. Does the
partitioning relation vary from one diesel fuel to another?
Compound y == == log(K dw ) x == == log(S) Z 1 Z 2 Z 3 Z 1 log(S) Z 3 log(S) Z 3 log(S)
Diesel fuel #1
1 3.67 −3.05 0 0 0 0 0 0
2 4.47 −3.72 0 0 0 0 0 0
3 4.31 −3.62 0 0 0 0 0 0
4 4.35 −3.98 0 0 0 0 0 0
5 4.45 −4.03 0 0 0 0 0 0
6 4.6 −4.50 0 0 0 0 0 0
7 5.15 −4.49 0 0 0 0 0 0
8 5.32 −5.19 0 0 0 0 0 0
Diesel fuel #2
1 3.62 −3.05 1 0 0 −3.05 0 0
2 4.29 −3.72 1 0 0 −3.72 0 0
3 4.21 −3.62 1 0 0 −3.62 0 0
4 4.46 −3.98 1 0 0 −3.98 0 0
5 4.41 −4.03 1 0 0 −4.03 0 0
6 4.61 −4.50 1 0 0 −4.50 0 0
7 5.38 −4.49 1 0 0 −4.49 0 0
8 4.64 −5.19 1 0 0 −5.19 0 0
Diesel fuel #3
1 3.71 −3.05 0 1 0 0 −3.05 0
2 4.44 −3.72 0 1 0 0 −3.72 0
3 4.36 −3.62 0 1 0 0 −3.62 0
4 4.68 −3.98 0 1 0 0 −3.98 0
5 4.52 −4.03 0 1 0 0 −4.03 0
6 4.78 −4.50 0 1 0 0 −4.50 0
7 5.36 −4.49 0 1 0 0 −4.49 0
8 5.61 −5.19 0 1 0 0 −5.19 0
Diesel fuel #4
1 3.71 −3.05 0 0 1 0 0 −3.05
2 4.49 −3.72 0 0 1 0 0 −3.72
3 4.33 −3.62 0 0 1 0 0 −3.62
4 4.62 −3.98 0 0 1 0 0 −3.98
5 4.55 −4.03 0 0 1 0 0 −4.03
6 4.78 −4.50 0 0 1 0 0 −4.50
7 5.20 −4.49 0 0 1 0 0 −4.49
8 5.60 −5.19 0 0 1 0 0 −5.19
Source: Lee, L. S. et al. (1992). Envir. Sci. Tech., 26, 2104–2110.
40.4 Threshold Concentration. The data below can be described by a hockey-stick pattern. Below
some threshold value (τ) the response is a constant plateau value (η = γ 0 ). Above the threshold,
the response is linear η = γ 0 + β 1 (x − τ). These can be combined into a continuous segmented
model using a dummy variable z such that z = 1 when x > τ and z = 0 when x ≤ τ. The dummy
variable formulation is η = γ 0 + β 1 (x − τ)z, where z is a dummy variable. This gives η = γ 0
for x ≤ τ and η = γ 0 + β 1 (x − τ) = γ 0 + β 1 x − β 1 τ for x ≥ τ. Estimate the plateau value γ 0 , the
post-threshold slope β 1 , and the unknown threshold dose τ.
© 2002 By CRC Press LLC