
Page 356 - Statistics for Environmental Engineers
P. 356
L1592_Frame_C41 Page 366 Tuesday, December 18, 2001 3:24 PM
24
y = 21.04 + 0.12x
23
y 22
21
20
19
0 2 4 6 8 10 12
x
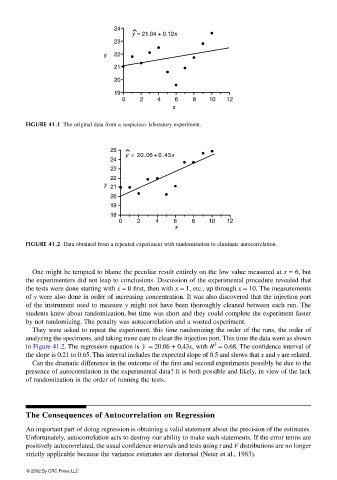
FIGURE 41.1 The original data from a suspicious laboratory experiment.
25
y = 20.06 + 0.43 x
24
23
22
y 21
20
19
18
0 2 4 6 8 10 12
x
FIGURE 41.2 Data obtained from a repeated experiment with randomization to eliminate autocorrelation.
One might be tempted to blame the peculiar result entirely on the low value measured at x = 6, but
the experimenters did not leap to conclusions. Discussion of the experimental procedure revealed that
the tests were done starting with x = 0 first, then with x = 1, etc., up through x = 10. The measurements
of y were also done in order of increasing concentration. It was also discovered that the injection port
of the instrument used to measure y might not have been thoroughly cleaned between each run. The
students knew about randomization, but time was short and they could complete the experiment faster
by not randomizing. The penalty was autocorrelation and a wasted experiment.
They were asked to repeat the experiment, this time randomizing the order of the runs, the order of
analyzing the specimens, and taking more care to clean the injection port. This time the data were as shown
in Figure 41.2. The regression equation is = 20.06 + 0.43x, with R = 0.68. The confidence interval ofy ˆ 2
the slope is 0.21 to 0.65. This interval includes the expected slope of 0.5 and shows that x and y are related.
Can the dramatic difference in the outcome of the first and second experiments possibly be due to the
presence of autocorrelation in the experimental data? It is both possible and likely, in view of the lack
of randomization in the order of running the tests.
The Consequences of Autocorrelation on Regression
An important part of doing regression is obtaining a valid statement about the precision of the estimates.
Unfortunately, autocorrelation acts to destroy our ability to make such statements. If the error terms are
positively autocorrelated, the usual confidence intervals and tests using t and F distributions are no longer
strictly applicable because the variance estimates are distorted (Neter et al., 1983).
© 2002 By CRC Press LLC