
Page 344 - Statistics for Environmental Engineers
P. 344
L1592_frame_C39 Page 353 Tuesday, December 18, 2001 3:22 PM
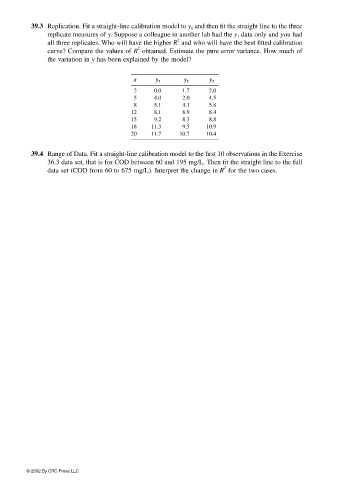
39.3 Replication. Fit a straight-line calibration model to y 1 and then fit the straight line to the three
replicate measures of y. Suppose a colleague in another lab had the y 1 data only and you had
2
all three replicates. Who will have the higher R and who will have the best fitted calibration
2
curve? Compare the values of R obtained. Estimate the pure error variance. How much of
the variation in y has been explained by the model?
x y 1 y 2 y 3
2 0.0 1.7 2.0
5 4.0 2.0 4.5
8 5.1 4.1 5.8
12 8.1 8.9 8.4
15 9.2 8.3 8.8
18 11.3 9.5 10.9
20 11.7 10.7 10.4
39.4 Range of Data. Fit a straight-line calibration model to the first 10 observations in the Exercise
36.3 data set, that is for COD between 60 and 195 mg/L. Then fit the straight line to the full
2
data set (COD from 60 to 675 mg/L). Interpret the change in R for the two cases.
© 2002 By CRC Press LLC