
Page 339 - Statistics for Environmental Engineers
P. 339
L1592_frame_C39 Page 348 Tuesday, December 18, 2001 3:22 PM
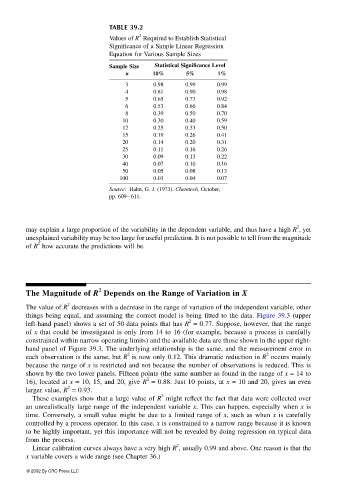
TABLE 39.2
2
Values of R Required to Establish Statistical
Significance of a Simple Linear Regression
Equation for Various Sample Sizes
Sample Size Statistical Significance Level
n 10% 5% 1%
3 0.98 0.99 0.99
4 0.81 0.90 0.98
5 0.65 0.77 0.92
6 0.53 0.66 0.84
8 0.39 0.50 0.70
10 0.30 0.40 0.59
12 0.25 0.33 0.50
15 0.19 0.26 0.41
20 0.14 0.20 0.31
25 0.11 0.16 0.26
30 0.09 0.13 0.22
40 0.07 0.10 0.16
50 0.05 0.08 0.13
100 0.03 0.04 0.07
Source: Hahn, G. J. (1973). Chemtech, October,
pp. 609– 611.
2
may explain a large proportion of the variability in the dependent variable, and thus have a high R , yet
unexplained variability may be too large for useful prediction. It is not possible to tell from the magnitude
2
of R how accurate the predictions will be.
2
The Magnitude of R Depends on the Range of Variation in X
2
The value of R decreases with a decrease in the range of variation of the independent variable, other
things being equal, and assuming the correct model is being fitted to the data. Figure 39.3 (upper
2
left-hand panel) shows a set of 50 data points that has R = 0.77. Suppose, however, that the range
of x that could be investigated is only from 14 to 16 (for example, because a process is carefully
constrained within narrow operating limits) and the available data are those shown in the upper right-
hand panel of Figure 39.3. The underlying relationship is the same, and the measurement error in
2 2
each observation is the same, but R is now only 0.12. This dramatic reduction in R occurs mainly
because the range of x is restricted and not because the number of observations is reduced. This is
shown by the two lower panels. Fifteen points (the same number as found in the range of x = 14 to
2
16), located at x = 10, 15, and 20, give R = 0.88. Just 10 points, at x = 10 and 20, gives an even
2
larger value, R = 0.93.
2
These examples show that a large value of R might reflect the fact that data were collected over
an unrealistically large range of the independent variable x. This can happen, especially when x is
time. Conversely, a small value might be due to a limited range of x, such as when x is carefully
controlled by a process operator. In this case, x is constrained to a narrow range because it is known
to be highly important, yet this importance will not be revealed by doing regression on typical data
from the process.
2
Linear calibration curves always have a very high R , usually 0.99 and above. One reason is that the
x variable covers a wide range (see Chapter 36.)
© 2002 By CRC Press LLC