
Page 334 - Statistics for Environmental Engineers
P. 334
L1592_frame_C38 Page 343 Tuesday, December 18, 2001 3:21 PM
term is added or deleted from the model, a check is made on whether the difference in the regression sum
of squares of the two models is large enough to justify modification of the model.
References
Berthouex, P. M. and D. K. Stevens (1982). “Computer Analysis of Settling Data,” J. Envr. Engr. Div., ASCE,
108, 1065–1069.
Camp, T. R. (1946). “Sedimentation and Design of Settling Tanks,” Trans. Am. Soc. Civil Engr., 3, 895–936.
Draper, N. R. and H. Smith (1998). Applied Regression Analysis, 3rd ed., New York, John Wiley.
Exercises
38.1 Settling Test. Find a polynomial model that describes the following data. The initial suspended
solids concentration was 560 mg/L. There are duplicate measurements at each time and depth.
Susp. Solids Conc. at Time t (min)
Depth (ft) 20 40 60 120
2 135 90 75 48
140 100 66 40
4 170 110 90 53
165 117 88 46
6 180 126 96 60
187 121 90 63
38.2 Solid Waste Fuel Value. Exercise 3.5 includes a table that relates solid waste composition to
the fuel value. The fuel value was calculated from the Dulong model, which uses elemental
composition instead of the percentages of paper, food, metal, and plastic. Develop a model
to relate the percentages of paper, food, metals, glass, and plastic to the Dulong estimates of
fuel value. One proposed model is E(Btu/lb) = 23 Food + 82.8 Paper + 160 Plastic. Compare
your model to this.
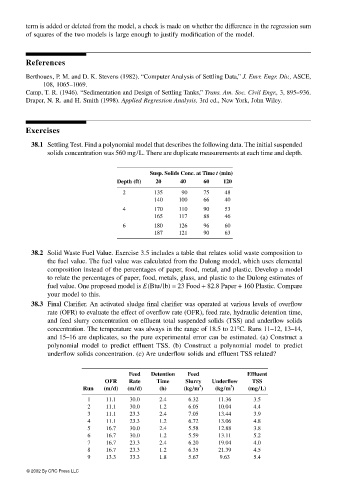
38.3 Final Clarifier. An activated sludge final clarifier was operated at various levels of overflow
rate (OFR) to evaluate the effect of overflow rate (OFR), feed rate, hydraulic detention time,
and feed slurry concentration on effluent total suspended solids (TSS) and underflow solids
concentration. The temperature was always in the range of 18.5 to 21°C. Runs 11–12, 13–14,
and 15–16 are duplicates, so the pure experimental error can be estimated. (a) Construct a
polynomial model to predict effluent TSS. (b) Construct a polynomial model to predict
underflow solids concentration. (c) Are underflow solids and effluent TSS related?
Feed Detention Feed Effluent
OFR Rate Time Slurry Underflow TSS
3 3
Run (m/d) (m/d) (h) (kg/m ) (kg/m ) (mg/L)
1 11.1 30.0 2.4 6.32 11.36 3.5
2 11.1 30.0 1.2 6.05 10.04 4.4
3 11.1 23.3 2.4 7.05 13.44 3.9
4 11.1 23.3 1.2 6.72 13.06 4.8
5 16.7 30.0 2.4 5.58 12.88 3.8
6 16.7 30.0 1.2 5.59 13.11 5.2
7 16.7 23.3 2.4 6.20 19.04 4.0
8 16.7 23.3 1.2 6.35 21.39 4.5
9 13.3 33.3 1.8 5.67 9.63 5.4
© 2002 By CRC Press LLC