Page 329 - Statistics for Environmental Engineers
P. 329

L1592_frame_C38  Page 338  Tuesday, December 18, 2001  3:21 PM


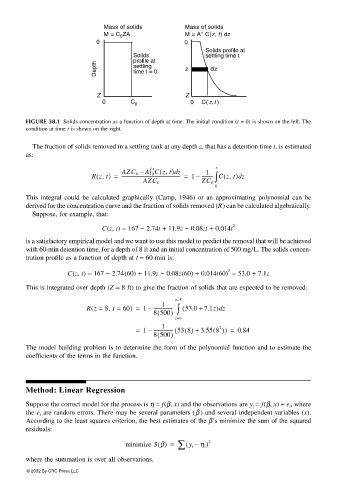
                                            Mass of solids         Mass of solids
                                            M = C ZA               M = A” C(z, t) dz
                                                 0
                                          0                        0
                                                                        Solids profile at
                                                    Solids              settling time t
                                                    profile at
                                          Depth     settling       z      dz
                                                    time t = 0


                                          Z                        Z
                                            0               C         0  0  C( z,t )


                       FIGURE 38.1 Solids concentration as a function of depth at time. The initial condition (t = 0) is shown on the left. The
                       condition at time t is shown on the right.

                        The fraction of solids removed in a settling tank at any depth z, that has a detention time t, is estimated
                       as:

                                                          z  (             z
                                                                d
                                                                         1
                                                                           ∫
                                         Rz, t) =  AZC 0 –  A∫ 0 Cz, t) z  1 –  ---------- Cz, t(  )d    z
                                          (
                                                 --------------------------------------------------- =
                                                       AZC 0           ZC 0
                                                                           0
                       This integral could be calculated graphically (Camp, 1946) or an approximating polynomial can be
                       derived for the concentration curve and the fraction of solids removed (R) can be calculated algebraically.
                        Suppose, for example, that:
                                            C(z, t) = 167 − 2.74t + 11.9z − 0.08zt + 0.014t 2
                       is a satisfactory empirical model and we want to use this model to predict the removal that will be achieved
                       with 60-min detention time, for a depth of 8 ft and an initial concentration of 500 mg/L. The solids concen-
                       tration profile as a function of depth at t = 60 min is:

                                                                               2
                                  C(z, t) = 167 − 2.74(60) + 11.9z − 0.08z(60) + 0.014(60)  = 53.0 + 7.1z
                       This is integrated over depth (Z = 8 ft) to give the fraction of solids that are expected to be removed:

                                                                z=8
                                                            1
                                         (
                                       Rz =  8, t =  60) =  1 –  -----------------  ∫  ( 53.0 +  7.1z) z
                                                                            d
                                                          8500)
                                                           (
                                                                z=0
                                                            1
                                                                            2
                                                     =  1 –  ----------------- 53 8() +(  3.55 8 ()) =  0.84
                                                          8500)
                                                           (
                       The model building problem is to determine the form of the polynomial function and to estimate the
                       coefficients of the terms in the function.
                       Method: Linear Regression

                       Suppose the correct model for the process is η = f(β, x) and the observations are y i  = f(β, x) + e i , where
                       the e i  are random errors. There may be several parameters (β ) and several independent variables (x).
                       According to the least squares criterion, the best estimates of the β’s minimize the sum of the squared
                       residuals:
                                                  minimize S β() =  ∑ ( y i η i )  2
                                                                      –
                       where the summation is over all observations.
                       © 2002 By CRC Press LLC
   324   325   326   327   328   329   330   331   332   333   334