
Page 324 - Statistics for Environmental Engineers
P. 324
L1592_frame_C37.fm Page 333 Tuesday, December 18, 2001 3:20 PM
4
• • •
•
Weighted Residuals 0 • • • • • • • • • • • • • • • • • • • • • • • • • • • •
2
•
•
•
-2
• • •
-4
100 1000 10,000 100,000 1,000,000
Predicted Peak for Nitrate
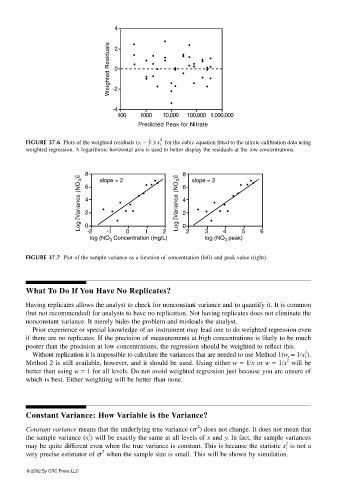
y ˆ 2 for the cubic equation fitted to the nitrate calibration data using
FIGURE 37.6 Plots of the weighted residuals (y i − )/s i
weighted regression. A logarithmic horizontal axis is used to better display the residuals at the low concentrations.
8 slope = 2 • • • • 8 6 slope = 2 • • • •
Log [Variance (NO 3 )] 4 • • • • • • • • Log [Variance (NO 3 )] 4 2 • • • • • • • •
6
•
•
2
0
-2
-1
1
0
2
4
log (NO Concentration (mg/L) 0 2 3 log (NO peak) 5 6
3
3
FIGURE 37.7 Plot of the sample variance as a function of concentration (left) and peak value (right).
What To Do If You Have No Replicates?
Having replicates allows the analyst to check for nonconstant variance and to quantify it. It is common
(but not recommended) for analysts to have no replication. Not having replicates does not eliminate the
nonconstant variance. It merely hides the problem and misleads the analyst.
Prior experience or special knowledge of an instrument may lead one to do weighted regression even
if there are no replicates. If the precision of measurements at high concentrations is likely to be much
poorer than the precision at low concentrations, the regression should be weighted to reflect this.
2
Without replication it is impossible to calculate the variances that are needed to use Method 1(w i = 1/ ).s i
2
Method 2 is still available, however, and it should be used. Using either w = 1/x or w = 1/x will be
better than using w = 1 for all levels. Do not avoid weighted regression just because you are unsure of
which is best. Either weighting will be better than none.
Constant Variance: How Variable is the Variance?
2
Constant variance means that the underlying true variance (σ ) does not change. It does not mean that
2
the sample variance ( ) will be exactly the same at all levels of x and y. In fact, the sample variances
s i
2
may be quite different even when the true variance is constant. This is because the statistic is not a
s i
2
very precise estimator of σ when the sample size is small. This will be shown by simulation.
© 2002 By CRC Press LLC