
Page 319 - Statistics for Environmental Engineers
P. 319
L1592_frame_C37.fm Page 328 Tuesday, December 18, 2001 3:20 PM
y = f(x)
(A) (B)
y = f(x)
(C) (D)
x x
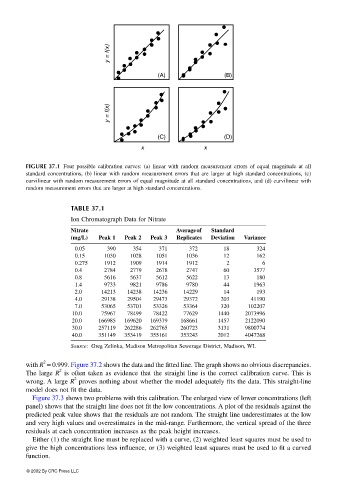
FIGURE 37.1 Four possible calibration curves: (a) linear with random measurement errors of equal magnitude at all
standard concentrations, (b) linear with random measurement errors that are larger at high standard concentrations, (c)
curvilinear with random measurement errors of equal magnitude at all standard concentrations, and (d) curvilinear with
random measurement errors that are larger at high standard concentrations.
TABLE 37.1
Ion Chromatograph Data for Nitrate
Nitrate Average of Standard
(mg/L) Peak 1 Peak 2 Peak 3 Replicates Deviation Variance
0.05 390 354 371 372 18 324
0.15 1030 1028 1051 1036 12 162
0.275 1912 1909 1914 1912 2 6
0.4 2784 2779 2678 2747 60 3577
0.8 5616 5637 5612 5622 13 180
1.4 9733 9821 9786 9780 44 1963
2.0 14213 14238 14236 14229 14 193
4.0 29138 29504 29473 29372 203 41190
7.0 53065 53701 53326 53364 320 102207
10.0 75967 78499 78422 77629 1440 2073996
20.0 166985 169620 169379 168661 1457 2122090
30.0 257119 262286 262765 260723 3131 9800774
40.0 351149 353419 355161 353243 2012 4047268
Source: Greg Zelinka, Madison Metropolitan Sewerage District, Madison, WI.
2
with R = 0.999. Figure 37.2 shows the data and the fitted line. The graph shows no obvious discrepancies.
2
The large R is often taken as evidence that the straight line is the correct calibration curve. This is
2
wrong. A large R proves nothing about whether the model adequately fits the data. This straight-line
model does not fit the data.
Figure 37.3 shows two problems with this calibration. The enlarged view of lower concentrations (left
panel) shows that the straight line does not fit the low concentrations. A plot of the residuals against the
predicted peak value shows that the residuals are not random. The straight line underestimates at the low
and very high values and overestimates in the mid-range. Furthermore, the vertical spread of the three
residuals at each concentration increases as the peak height increases.
Either (1) the straight line must be replaced with a curve, (2) weighted least squares must be used to
give the high concentrations less influence, or (3) weighted least squares must be used to fit a curved
function.
© 2002 By CRC Press LLC