
Page 320 - Statistics for Environmental Engineers
P. 320
L1592_frame_C37.fm Page 329 Tuesday, December 18, 2001 3:20 PM
350 (a) Straight line
Peak Height (1000s) 150
fitted to all data
250
50
-50
0 10 20 30 40
Nitrate Concentration (mg/L)
FIGURE 37.2 Plot of the nitrate calibration data and a straight line fitted by ordinary (unweighted) least squares.
100
(a) Fitted straight line in 10 (b) Residuals of fitted
the region of low
80 straight line
concentrations
60
40 Residuals (1000s) 0
20
0
-10
0 2 4 6 8 10 -100 0 100 200 300 400
Nitrate Concentration (mg/L) Predicted Peak Height (1000s)
FIGURE 37.3 (a) Expanded view of the straight-line calibration shows lack of fit at low concentrations. (b) Residuals of
the straight-line model show lack of fit and suggest that a quadratic or cubic calibration model should be tried. The greater
spread of triplicates at higher values of peak height also suggests that weighting would be appropriate.
Residuals from Average of 3 Replicates –2000 • • • • • • • • • • • • • • • • • • • •
4000
2000
0
•
•
–4000
40
0
20
10
30
Nitrate Concentration (mg/L) 50
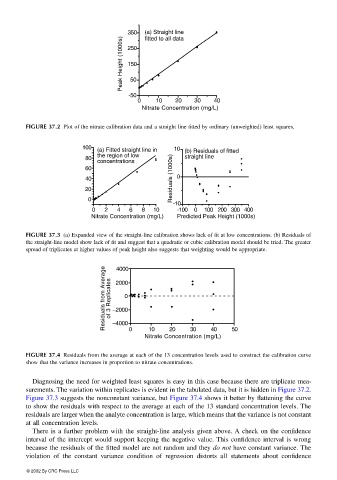
FIGURE 37.4 Residuals from the average at each of the 13 concentration levels used to construct the calibration curve
show that the variance increases in proportion to nitrate concentrations.
Diagnosing the need for weighted least squares is easy in this case because there are triplicate mea-
surements. The variation within replicates is evident in the tabulated data, but it is hidden in Figure 37.2.
Figure 37.3 suggests the nonconstant variance, but Figure 37.4 shows it better by flattening the curve
to show the residuals with respect to the average at each of the 13 standard concentration levels. The
residuals are larger when the analyte concentration is large, which means that the variance is not constant
at all concentration levels.
There is a further problem with the straight-line analysis given above. A check on the confidence
interval of the intercept would support keeping the negative value. This confidence interval is wrong
because the residuals of the fitted model are not random and they do not have constant variance. The
violation of the constant variance condition of regression distorts all statements about confidence
© 2002 By CRC Press LLC