
Page 314 - Statistics for Environmental Engineers
P. 314
L1592_frame_C36.fm Page 322 Tuesday, December 18, 2001 3:20 PM
2 is the lower α /2 percentile point of the χ 2
χ ν,α/2 distribution, where ν = n − 2 degrees of freedom
2
associated with the variance estimate (s ).
This interval for y and the Working–Hotelling confidence band for the calibration line are used to
estimate a confidence interval about for the true concentration ξ. This typically is done graphically.x ˆ
Hunter (1981) provides a full derivation and explanation of the procedure.
Case Study: Solution
The fitted model calibration line is:
y = b 0 + b 1 x = 0.556 + 139.759x
2
The estimate of the variance is s = 1.194, which has ν = 15 − 2 = 13 degrees of freedom. The estimated
variances of the parameters are Var (b 0 ) = 0.2237 and Var (b 1 ) = 8.346. The appropriate value of the t
statistic for estimation of the 95% confidence intervals of the parameters is t 13,0.025 = 2.16, giving 95%
confidence intervals as follows:
β 0 = 0.566 ± 1.023 or – 0.457 < β 0 < 1.589
β 1 = 139.759 ± 6.242 or 133.52 < β 1 < 146.00
Using the Calibration Curve to Predict Concentrations
Suppose that the chemist measured a peak area of 22.0. The predicted concentration is read from the
calibration line or computed from the calibration equation:
x ˆ = ( yb 0 )/b 1 = ( 22.0 0.566)/139.76 = 0.153.
–
–
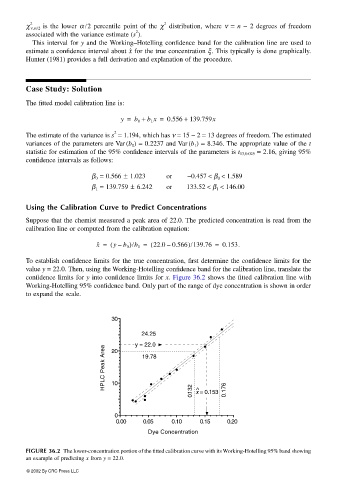
To establish confidence limits for the true concentration, first determine the confidence limits for the
value y = 22.0. Then, using the Working-Hotelling confidence band for the calibration line, translate the
confidence limits for y into confidence limits for x. Figure 36.2 shows the fitted calibration line with
Working-Hotelling 95% confidence band. Only part of the range of dye concentration is shown in order
to expand the scale.
30
24.25
y = 22.0
HPLC Peak Area 10 0. 132 ^ 0.176
20
19.78
0 x = 0.153
0.00 0.05 0.10 0.15 0.20
Dye Concentration
FIGURE 36.2 The lower-concentration portion of the fitted calibration curve with its Working-Hotelling 95% band showing
an example of predicting x from y = 22.0.
© 2002 By CRC Press LLC