
Page 310 - Statistics for Environmental Engineers
P. 310
L1592_frame_C35 Page 317 Tuesday, December 18, 2001 2:52 PM
10.0 0.22 0.22 0.22
20.0 0.51 0.51 0.51
40.0 — 0.48 0.48
50.0 — 0.29 0.29
60.0 — 0.20 0.20
70.0 — 0.12 0.12
For each experiment, use nonlinear least squares to (a) estimate the two parameters in the
model, (b) plot the predicted and observed concentrations of B vs. time, (c) plot the residuals
vs. time and vs. the predicted concentration of B, and (d) plot the approximate 95% joint
confidence region for the estimated parameters. Discuss the difference between the result
obtained for the three experiments.
35.8 Modeling. Discuss two environmental engineering systems that are described by the model
in Exercise 35.7. The systems may be natural or constructed. Optional: Find some data for
one of the systems and analyze it.
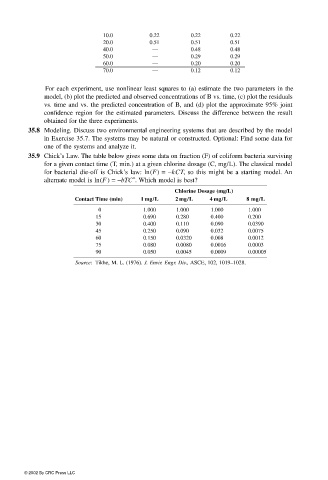
35.9 Chick’s Law. The table below gives some data on fraction (F) of coliform bacteria surviving
for a given contact time (T, min.) at a given chlorine dosage (C, mg/L). The classical model
for bacterial die-off is Chick’s law: ln(F) = −kCT, so this might be a starting model. An
a
alternate model is ln(F ) = −bTC . Which model is best?
Chlorine Dosage (mg/L)
Contact Time (min) 1 mg/L 2 mg/L 4 mg/L 8 mg/L
0 1.000 1.000 1.000 1.000
15 0.690 0.280 0.400 0.200
30 0.400 0.110 0.090 0.0390
45 0.250 0.090 0.032 0.0075
60 0.150 0.0320 0.008 0.0012
75 0.080 0.0080 0.0016 0.0003
90 0.050 0.0045 0.0009 0.00005
Source: Tikhe, M. L. (1976). J. Envir. Engr. Div., ASCE, 102, 1019–1028.
© 2002 By CRC Press LLC