
Page 309 - Statistics for Environmental Engineers
P. 309
L1592_frame_C35 Page 316 Tuesday, December 18, 2001 2:52 PM
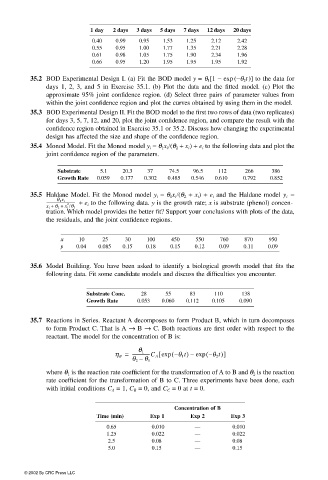
1 day 2 days 3 days 5 days 7 days 12 days 20 days
0.40 0.99 0.95 1.53 1.25 2.12 2.42
0.55 0.95 1.00 1.77 1.35 2.21 2.28
0.61 0.98 1.05 1.75 1.90 2.34 1.96
0.66 0.95 1.20 1.95 1.95 1.95 1.92
35.2 BOD Experimental Design I. (a) Fit the BOD model y = θ 1 [1 − exp (−θ 2 t )] to the data for
days 1, 2, 3, and 5 in Exercise 35.1. (b) Plot the data and the fitted model. (c) Plot the
approximate 95% joint confidence region. (d) Select three pairs of parameter values from
within the joint confidence region and plot the curves obtained by using them in the model.
35.3 BOD Experimental Design II. Fit the BOD model to the first two rows of data (two replicates)
for days 3, 5, 7, 12, and 20, plot the joint confidence region, and compare the result with the
confidence region obtained in Exercise 35.1 or 35.2. Discuss how changing the experimental
design has affected the size and shape of the confidence region.
35.4 Monod Model. Fit the Monod model y i = θ 1 x i /(θ 2 + x i ) + e i to the following data and plot the
joint confidence region of the parameters.
Substrate 5.1 20.3 37 74.5 96.5 112 266 386
Growth Rate 0.059 0.177 0.302 0.485 0.546 0.610 0.792 0.852
35.5 Haldane Model. Fit the Monod model y i = θ 1 x i (θ 2 + x i ) + e i and the Haldane model y i =
θ 1 x i
---------------------------------- + e i to the following data. y is the growth rate; x is substrate (phenol) concen-
2
x i + θ 2 + x i /θ 3
tration. Which model provides the better fit? Support your conclusions with plots of the data,
the residuals, and the joint confidence regions.
x 10 25 30 100 450 550 760 870 950
y 0.04 0.085 0.15 0.18 0.15 0.12 0.09 0.11 0.09
35.6 Model Building. You have been asked to identify a biological growth model that fits the
following data. Fit some candidate models and discuss the difficulties you encounter.
Substrate Conc. 28 55 83 110 138
Growth Rate 0.053 0.060 0.112 0.105 0.090
35.7 Reactions in Series. Reactant A decomposes to form Product B, which in turn decomposes
to form Product C. That is A → B → C. Both reactions are first order with respect to the
reactant. The model for the concentration of B is:
η B = ----------------C A exp[ – ( θ 1 t) – exp – ( θ 2 t)]
θ 1
–
θ 2 θ 1
where θ 1 is the reaction rate coefficient for the transformation of A to B and θ 2 is the reaction
rate coefficient for the transformation of B to C. Three experiments have been done, each
with initial conditions C A = 1, C B = 0, and C C = 0 at t = 0.
Concentration of B
Time (min) Exp 1 Exp 2 Exp 3
0.65 0.010 — 0.010
1.25 0.022 — 0.022
2.5 0.08 — 0.08
5.0 0.15 — 0.15
© 2002 By CRC Press LLC