
Page 341 - Statistics for Environmental Engineers
P. 341
L1592_frame_C39 Page 350 Tuesday, December 18, 2001 3:22 PM
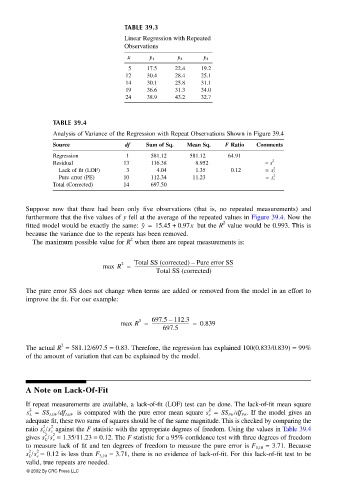
TABLE 39.3
Linear Regression with Repeated
Observations
x y 1 y 2 y 3
5 17.5 22.4 19.2
12 30.4 28.4 25.1
14 30.1 25.8 31.1
19 36.6 31.3 34.0
24 38.9 43.2 32.7
TABLE 39.4
Analysis of Variance of the Regression with Repeat Observations Shown in Figure 39.4
Source df Sum of Sq. Mean Sq. F Ratio Comments
Regression 1 581.12 581.12 64.91
Residual 13 116.38 8.952 = s 2
Lack of fit (LOF) 3 4.04 1.35 0.12 = s L 2
Pure error (PE) 10 112.34 11.23 = s e 2
Total (Corrected) 14 697.50
Suppose now that there had been only five observations (that is, no repeated measurements) and
furthermore that the five values of y fell at the average of the repeated values in Figure 39.4. Now the
fitted model would be exactly the same: y ˆ = 15.45 + 0.97x but the R value would be 0.993. This is
2
because the variance due to the repeats has been removed.
2
The maximum possible value for R when there are repeat measurements is:
–
max R = Total SS (corrected) Pure error SS
2
---------------------------------------------------------------------------------------
Total SS (corrected)
The pure error SS does not change when terms are added or removed from the model in an effort to
improve the fit. For our example:
–
--------------------------------- =
max R = 697.5 112.3 0.839
2
697.5
2
The actual R = 581.12/697.5 = 0.83. Therefore, the regression has explained 100(0.833/0.839) = 99%
of the amount of variation that can be explained by the model.
A Note on Lack-Of-Fit
If repeat measurements are available, a lack-of-fit (LOF) test can be done. The lack-of-fit mean square
s L = SS LOF /df LOF is compared with the pure error mean square s e = SS PE /df PE . If the model gives an
2
2
adequate fit, these two sums of squares should be of the same magnitude. This is checked by comparing the
2 2
ratio s L /s e against the F statistic with the appropriate degrees of freedom. Using the values in Table 39.4
2 2
gives s L /s e = 1.35/11.23 = 0.12. The F statistic for a 95% confidence test with three degrees of freedom
to measure lack of fit and ten degrees of freedom to measure the pure error is F 3,10 = 3.71. Because
2 2
s L /s e = 0.12 is less than F 3,10 = 3.71, there is no evidence of lack-of-fit. For this lack-of-fit test to be
valid, true repeats are needed.
© 2002 By CRC Press LLC