
Page 234 - Steam Turbines Design, Applications, and Rerating
P. 234
Campbell, Goodman, and SAFE Diagrams for Steam Turbine Blades 213
but at lower speeds. These are marked as P3 and P4 on the plot. By
similar argument, any mode between 0- and 20-nodal diameters can be
excited by force shapes higher than cos 20θ. These points are also
shown up to 80-nodal diameters. It should, however, not be inferred
that any force shape can excite any mode. There is a special relation-
ship between mode shapes, shapes of the force, and total number of
blades on the disk. This relationship can be described as follows: The
M-nodal diameter mode will be excited by a force having a shape of cos
Mθ, cos (N − M)θ, cos (N + M)θ, cos (2N − M)θ, cos (2N + M)θ, etc. In the
above example, M is 15 and N is 40; hence, a force of cos 15θ, cos 25θ,
cos 55θ, cos 65θ, cos 95θ, etc. will excite the 15-nodal diameter mode but
at different speeds. Hence, the M-nodal diameter mode can be excited
by a force having a cos Lθ shape where L = n ⋅ N ± M, and where n = 0,
1, 2, 3–, N and N is the number of blades.
Let us identify the plot between 0- and 20-nodal diameter as Zone I,
between 20- and 40-nodal diameter as Zone II and so on. Zone II is a
mirror image of Zone I, Zone III is a mirror image of Zone II, etc. Hence,
Zone I contains all the information about the structure. The reflections
of speed lines about vertical lines passing through 0- and 20-nodal
diameters are required in the first zone. It can be seen that all reflected
speed lines pass through the same 15-nodal diameter point in Zone I.
These discussions can be summarized as follows:
1. Zone I as traditionally drawn contains all the information about the
vibrating structure.
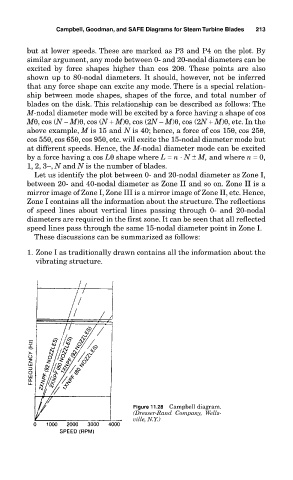
Figure 11.28 Campbell diagram.
(Dresser-Rand Company, Wells-
ville, N.Y.)