
Page 156 -
P. 156
122 PART 2 • STRATEGY FORMULATION
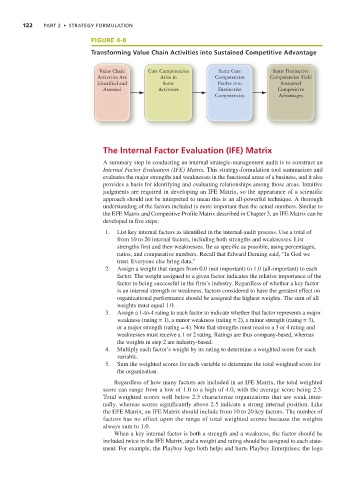
FIGURE 4-8
Transforming Value Chain Activities into Sustained Competitive Advantage
Value Chain Core Competencies Some Core Some Distinctive
Activities Are Arise in Competencies Competencies Yield
Identified and Some Evolve into Sustained
Assessed Activities Distinctive Competitive
Competencies Advantages
The Internal Factor Evaluation (IFE) Matrix
A summary step in conducting an internal strategic-management audit is to construct an
Internal Factor Evaluation (IFE) Matrix. This strategy-formulation tool summarizes and
evaluates the major strengths and weaknesses in the functional areas of a business, and it also
provides a basis for identifying and evaluating relationships among those areas. Intuitive
judgments are required in developing an IFE Matrix, so the appearance of a scientific
approach should not be interpreted to mean this is an all-powerful technique. A thorough
understanding of the factors included is more important than the actual numbers. Similar to
the EFE Matrix and Competitive Profile Matrix described in Chapter 3, an IFE Matrix can be
developed in five steps:
1. List key internal factors as identified in the internal-audit process. Use a total of
from 10 to 20 internal factors, including both strengths and weaknesses. List
strengths first and then weaknesses. Be as specific as possible, using percentages,
ratios, and comparative numbers. Recall that Edward Deming said, “In God we
trust. Everyone else bring data.”
2. Assign a weight that ranges from 0.0 (not important) to 1.0 (all-important) to each
factor. The weight assigned to a given factor indicates the relative importance of the
factor to being successful in the firm’s industry. Regardless of whether a key factor
is an internal strength or weakness, factors considered to have the greatest effect on
organizational performance should be assigned the highest weights. The sum of all
weights must equal 1.0.
3. Assign a 1-to-4 rating to each factor to indicate whether that factor represents a major
weakness (rating = 1), a minor weakness (rating = 2), a minor strength (rating = 3),
or a major strength (rating = 4). Note that strengths must receive a 3 or 4 rating and
weaknesses must receive a 1 or 2 rating. Ratings are thus company-based, whereas
the weights in step 2 are industry-based.
4. Multiply each factor’s weight by its rating to determine a weighted score for each
variable.
5. Sum the weighted scores for each variable to determine the total weighted score for
the organization.
Regardless of how many factors are included in an IFE Matrix, the total weighted
score can range from a low of 1.0 to a high of 4.0, with the average score being 2.5.
Total weighted scores well below 2.5 characterize organizations that are weak inter-
nally, whereas scores significantly above 2.5 indicate a strong internal position. Like
the EFE Matrix, an IFE Matrix should include from 10 to 20 key factors. The number of
factors has no effect upon the range of total weighted scores because the weights
always sum to 1.0.
When a key internal factor is both a strength and a weakness, the factor should be
included twice in the IFE Matrix, and a weight and rating should be assigned to each state-
ment. For example, the Playboy logo both helps and hurts Playboy Enterprises; the logo