
Page 412 -
P. 412
8 MERNOUSH BANTON
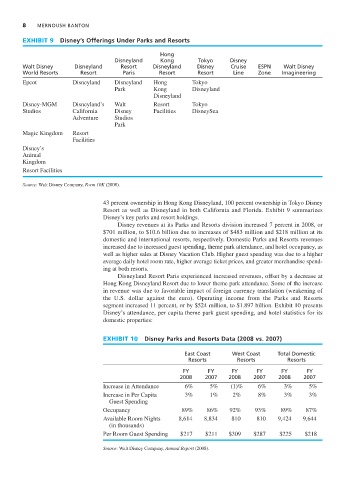
EXHIBIT 9 Disney’s Offerings Under Parks and Resorts
Hong
Disneyland Kong Tokyo Disney
Walt Disney Disneyland Resort Disneyland Disney Cruise ESPN Walt Disney
World Resorts Resort Paris Resort Resort Line Zone Imagineering
Epcot Disneyland Disneyland Hong Tokyo
Park Kong Disneyland
Disneyland
Disney-MGM Disneyland’s Walt Resort Tokyo
Studios California Disney Facilities DisneySea
Adventure Studios
Park
Magic Kingdom Resort
Facilities
Disney’s
Animal
Kingdom
Resort Facilities
Source: Walt Disney Company, Form 10K (2008).
43 percent ownership in Hong Kong Disneyland, 100 percent ownership in Tokyo Disney
Resort as well as Disneyland in both California and Florida. Exhibit 9 summarizes
Disney’s key parks and resort holdings.
Disney revenues at its Parks and Resorts division increased 7 percent in 2008, or
$701 million, to $10.6 billion due to increases of $483 million and $218 million at its
domestic and international resorts, respectively. Domestic Parks and Resorts revenues
increased due to increased guest spending, theme park attendance, and hotel occupancy, as
well as higher sales at Disney Vacation Club. Higher guest spending was due to a higher
average daily hotel room rate, higher average ticket prices, and greater merchandise spend-
ing at both resorts.
Disneyland Resort Paris experienced increased revenues, offset by a decrease at
Hong Kong Disneyland Resort due to lower theme park attendance. Some of the increase
in revenue was due to favorable impact of foreign currency translation (weakening of
the U.S. dollar against the euro). Operating income from the Parks and Resorts
segment increased 11 percent, or by $524 million, to $1.897 billion. Exhibit 10 presents
Disney’s attendance, per capita theme park guest spending, and hotel statistics for its
domestic properties:
EXHIBIT 10 Disney Parks and Resorts Data (2008 vs. 2007)
East Coast West Coast Total Domestic
Resorts Resorts Resorts
FY FY FY FY FY FY
2008 2007 2008 2007 2008 2007
Increase in Attendance 6% 5% (1)% 6% 3% 5%
Increase in Per Capita 3% 1% 2% 8% 3% 3%
Guest Spending
Occupancy 89% 86% 92% 93% 89% 87%
Available Room Nights 8,614 8,834 810 810 9,424 9,644
(in thousands)
Per Room Guest Spending $217 $211 $309 $287 $225 $218
Source: Walt Disney Company, Annual Report (2008).