
Page 407 -
P. 407
CASE 1 • WALT DISNEY COMPANY — 2009 3
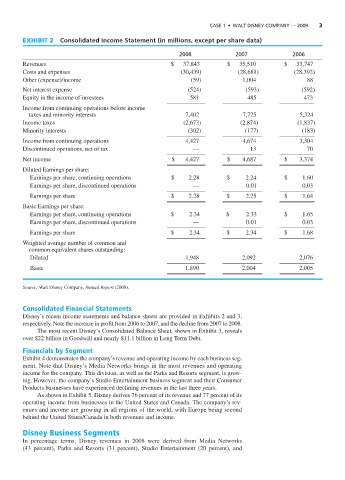
EXHIBIT 2 Consolidated Income Statement (in millions, except per share data)
2008 2007 2006
Revenues $ 37,843 $ 35,510 $ 33,747
Costs and expenses (30,439) (28,681) (28,392)
Other (expense)/income (59) 1,004 88
Net interest expense (524) (593) (592)
Equity in the income of investees 581 485 473
Income from continuing operations before income
taxes and minority interests 7,402 7,725 5,324
Income taxes (2,673) (2,874) (1,837)
Minority interests (302) (177) (183)
Income from continuing operations 4,427 4,674 3,304
Discontinued operations, net of tax — 13 70
Net income $ 4,427 $ 4,687 $ 3,374
Diluted Earnings per share:
Earnings per share, continuing operations $ 2.28 $ 2.24 $ 1.60
Earnings per share, discontinued operations — 0.01 0.03
Earnings per share $ 2.28 $ 2.25 $ 1.64
Basic Earnings per share:
Earnings per share, continuing operations $ 2.34 $ 2.33 $ 1.65
Earnings per share, discontinued operations — 0.01 0.03
Earnings per share $ 2.34 $ 2.34 $ 1.68
Weighted average number of common and
common equivalent shares outstanding:
Diluted 1,948 2,092 2,076
Basic 1,890 2,004 2,005
Source: Walt Disney Company, Annual Report (2008).
Consolidated Financial Statements
Disney’s recent income statements and balance sheets are provided in Exhibits 2 and 3,
respectively. Note the increase in profit from 2006 to 2007, and the decline from 2007 to 2008.
The most recent Disney’s Consolidated Balance Sheet, shown in Exhibit 3, reveals
over $22 billion in Goodwill and nearly $11.1 billion in Long Term Debt.
Financials by Segment
Exhibit 4 demonstrates the company’s revenue and operating income by each business seg-
ment. Note that Disney’s Media Networks brings in the most revenues and operating
income for the company. This division, as well as the Parks and Resorts segment, is grow-
ing. However, the company’s Studio Entertainment business segment and their Consumer
Products businesses have experienced declining revenues in the last three years.
As shown in Exhibit 5, Disney derives 76 percent of its revenue and 77 percent of its
operating income from businesses in the United States and Canada. The company’s rev-
enues and income are growing in all regions of the world, with Europe being second
behind the United States/Canada in both revenues and income.
Disney Business Segments
In percentage terms, Disney revenues in 2008 were derived from Media Networks
(43 percent), Parks and Resorts (31 percent), Studio Entertainment (20 percent), and