
Page 409 -
P. 409
CASE 1 • WALT DISNEY COMPANY — 2009 5
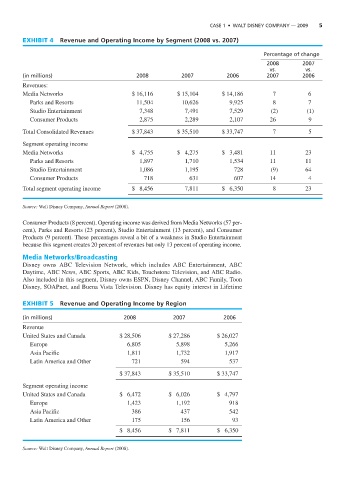
EXHIBIT 4 Revenue and Operating Income by Segment (2008 vs. 2007)
Percentage of change
2008 2007
vs. vs.
(in millions) 2008 2007 2006 2007 2006
Revenues:
Media Networks $ 16,116 $ 15,104 $ 14,186 7 6
Parks and Resorts 11,504 10,626 9,925 8 7
Studio Entertainment 7,348 7,491 7,529 (2) (1)
Consumer Products 2,875 2,289 2,107 26 9
Total Consolidated Revenues $ 37,843 $ 35,510 $ 33,747 7 5
Segment operating income
Media Networks $ 4,755 $ 4,275 $ 3,481 11 23
Parks and Resorts 1,897 1,710 1,534 11 11
Studio Entertainment 1,086 1,195 728 (9) 64
Consumer Products 718 631 607 14 4
Total segment operating income $ 8,456 7,811 $ 6,350 8 23
Source: Walt Disney Company, Annual Report (2008).
Consumer Products (8 percent). Operating income was derived from Media Networks (57 per-
cent), Parks and Resorts (23 percent), Studio Entertainment (13 percent), and Consumer
Products (9 percent). These percentages reveal a bit of a weakness in Studio Entertainment
because this segment creates 20 percent of revenues but only 13 percent of operating income.
Media Networks/Broadcasting
Disney owns ABC Television Network, which includes ABC Entertainment, ABC
Daytime, ABC News, ABC Sports, ABC Kids, Touchstone Television, and ABC Radio.
Also included in this segment, Disney owns ESPN, Disney Channel, ABC Family, Toon
Disney, SOAPnet, and Buena Vista Television. Disney has equity interest in Lifetime
EXHIBIT 5 Revenue and Operating Income by Region
(in millions) 2008 2007 2006
Revenue
United States and Canada $ 28,506 $ 27,286 $ 26,027
Europe 6,805 5,898 5,266
Asia Pacific 1,811 1,732 1,917
Latin America and Other 721 594 537
$ 37,843 $ 35,510 $ 33,747
Segment operating income
United States and Canada $ 6,472 $ 6,026 $ 4,797
Europe 1,423 1,192 918
Asia Pacific 386 437 542
Latin America and Other 175 156 93
$ 8,456 $ 7,811 $ 6,350
Source: Walt Disney Company, Annual Report (2008).