
Page 429 -
P. 429
CASE 2 • MERRYLAND AMUSEMENT PARK — 2009 25
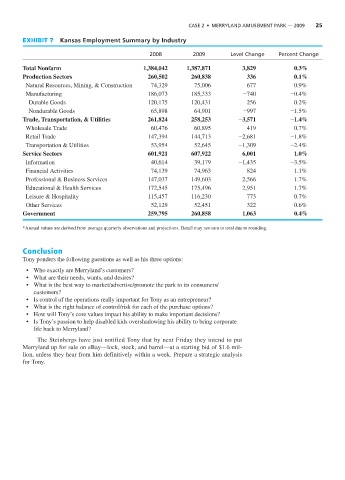
EXHIBIT 7 Kansas Employment Summary by Industry
2008 2009 Level Change Percent Change
Total Nonfarm 1,384,042 1,387,871 3,829 0.3%
Production Sectors 260,502 260,838 336 0.1%
Natural Resources, Mining, & Construction 74,329 75,006 677 0.9%
Manufacturing 186,073 185,333 -740 -0.4%
Durable Goods 120,175 120,431 256 0.2%
Nondurable Goods 65,898 64,901 -997 -1.5%
Trade, Transportation, & Utilities 261,824 258,253 -3,571 -1.4%
Wholesale Trade 60,476 60,895 419 0.7%
Retail Trade 147,394 144,713 -2,681 -1.8%
Transportation & Utilities 53,954 52,645 -1,309 -2.4%
Service Sectors 601,921 607,922 6,001 1.0%
Information 40,614 39,179 -1,435 -3.5%
Financial Activities 74,139 74,963 824 1.1%
Professional & Business Services 147,037 149,603 2,566 1.7%
Educational & Health Services 172,545 175,496 2,951 1.7%
Leisure & Hospitality 115,457 116,230 773 0.7%
Other Services 52,129 52,451 322 0.6%
Government 259,795 260,858 1,063 0.4%
*Annual values are derived from average quarterly observations and projections. Detail may not sum to total due to rounding.
Conclusion
Tony ponders the following guestions as well as his three options:
• Who exactly are Merryland’s customers?
• What are their needs, wants, and desires?
• What is the best way to market/advertise/promote the park to its consumers/
customers?
• Is control of the operations really important for Tony as an entrepreneur?
• What is the right balance of control/risk for each of the purchase options?
• How will Tony’s core values impact his ability to make important decisions?
• Is Tony’s passion to help disabled kids overshadowing his ability to bring corporate
life back to Merryland?
The Steinbergs have just notified Tony that by next Friday they intend to put
Merryland up for sale on eBay—lock, stock, and barrel—at a starting bid of $1.6 mil-
lion, unless they hear from him definitively within a week. Prepare a strategic analysis
for Tony.