Page 428 -
P. 428

24    GREGORY STONE


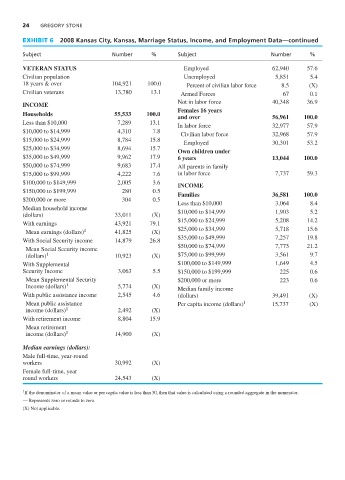
           EXHIBIT 6   2008 Kansas City, Kansas, Marriage Status, Income, and Employment Data—continued
           Subject                      Number       %        Subject                        Number      %

           VETERAN STATUS                                       Employed                     62,940     57.6
           Civilian population                                  Unemployed                    5,851      5.4
           18 years & over              104,921     100.0        Percent of civilian labor force  8.5    (X)
           Civilian veterans             13,780      13.1      Armed Forces                      67      0.1
                                                              Not in labor force             40,348     36.9
           INCOME
                                                              Females 16 years
           Households                    55,533     100.0
                                                              and over                       56,961    100.0
           Less than $10,000              7,289      13.1
                                                              In labor force                 32,977     57.9
           $10,000 to $14,999             4,310       7.8
                                                               Civilian labor force          32,968     57.9
           $15,000 to $24,999             8,784      15.8
                                                                Employed                     30,301     53.2
           $25,000 to $34,999             8,694      15.7
                                                              Own children under
           $35,000 to $49,999             9,962      17.9     6 years                        13,044    100.0
           $50,000 to $74,999             9,683      17.4     All parents in family
           $75,000 to $99,999             4,222       7.6     in labor force                  7,737     59.3
           $100,000 to $149,999           2,005       3.6
                                                              INCOME
           $150,000 to $199,999             280       0.5
                                                              Families                       36,581    100.0
           $200,000 or more                 304       0.5
                                                              Less than $10,000               3,064      8.4
           Median household income
           (dollars)                     33,011       (X)     $10,000 to $14,999              1,903      5.2
                                                              $15,000 to $24,999              5,208     14.2
           With earnings                 43,921      79.1
                                                              $25,000 to $34,999              5,718     15.6
                               1
            Mean earnings (dollars)      41,825       (X)
                                                              $35,000 to $49,999              7,257     19.8
           With Social Security income   14,879      26.8
                                                              $50,000 to $74,999              7,773     21.2
            Mean Social Security income
            (dollars) 1                  10,923       (X)     $75,000 to $99,999              3,561      9.7
           With Supplemental                                  $100,000 to $149,999            1,649      4.5
           Security Income                3,063       5.5     $150,000 to $199,999              225      0.6
            Mean Supplemental Security                        $200,000 or more                  223      0.6
            Income (dollars) 1            5,774       (X)
                                                              Median family income
           With public assistance income  2,545       4.6     (dollars)                      39,491      (X)
            Mean public assistance                            Per capita income (dollars) 1  15,737      (X)
            income (dollars) 1            2,492       (X)
           With retirement income         8,804      15.9
            Mean retirement
            income (dollars) 1           14,900       (X)
           Median earnings (dollars):
           Male full-time, year-round
           workers                       30,992       (X)
           Female full-time, year
           round workers                 24,543       (X)

           1 If the denominator of a mean value or per capita value is less than 30, then that value is calculated using a rounded aggregate in the numerator.
           — Represents zero or rounds to zero.
           (X) Not applicable.
   423   424   425   426   427   428   429   430   431   432   433