Page 427 -
P. 427

CASE 2 • MERRYLAND AMUSEMENT PARK — 2009  23

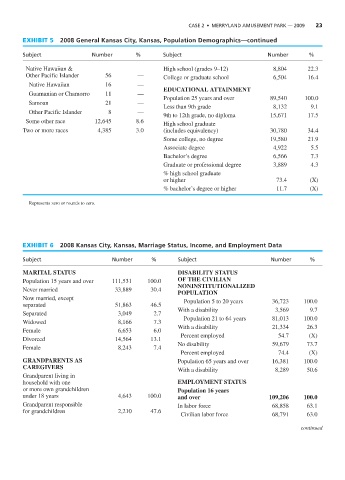
              EXHIBIT 5   2008 General Kansas City, Kansas, Population Demographics—continued
              Subject               Number         %        Subject                           Number        %

               Native Hawaiian &                            High school (grades 9–12)           8,804      22.3
               Other Pacific Islander    56        —        College or graduate school          6,504      16.4
                Native Hawaiian          16        —
                                                            EDUCATIONAL ATTAINMENT
                Guamanian or Chamorro    11        —
                                                            Population 25 years and over       89,540     100.0
                Samoan                   21        —
                                                            Less than 9th grade                 8,132       9.1
                Other Pacific Islander    8        —
                                                            9th to 12th grade, no diploma      15,671      17.5
               Some other race       12,645        8.6
                                                            High school graduate
              Two or more races       4,385        3.0      (includes equivalency)             30,780      34.4
                                                            Some college, no degree            19,580      21.9
                                                            Associate degree                    4,922       5.5
                                                            Bachelor’s degree                   6,566       7.3
                                                            Graduate or professional degree     3,889       4.3
                                                            % high school graduate
                                                            or higher                            73.4       (X)
                                                            % bachelor’s degree or higher        11.7       (X)

              — Represents zero or rounds to zero.


              EXHIBIT 6   2008 Kansas City, Kansas, Marriage Status, Income, and Employment Data

              Subject                      Number       %        Subject                       Number       %

              MARITAL STATUS                                    DISABILITY STATUS
              Population 15 years and over  111,531    100.0    OF THE CIVILIAN
                                                                NONINSTITUTIONALIZED
              Never married                 33,889      30.4
                                                                POPULATION
              Now married, except
              separated                     51,863      46.5      Population 5 to 20 years     36,723     100.0
                                                                With a disability               3,569       9.7
              Separated                      3,049       2.7
                                                                  Population 21 to 64 years    81,013     100.0
              Widowed                        8,166       7.3
                                                                With a disability              21,334      26.3
              Female                         6,653       6.0
                                                                 Percent employed                54.7       (X)
              Divorced                      14,564      13.1
                                                                No disability                  59,679      73.7
              Female                         8,243       7.4
                                                                 Percent employed                74.4       (X)
              GRANDPARENTS AS                                   Population 65 years and over   16,381     100.0
              CAREGIVERS
                                                                With a disability               8,289      50.6
              Grandparent living in
              household with one                                EMPLOYMENT STATUS
              or more own grandchildren                         Population 16 years
              under 18 years                 4,643     100.0    and over                      109,206     100.0
              Grandparent responsible                           In labor force                 68,858      63.1
              for grandchildren              2,210      47.6
                                                                 Civilian labor force          68,791      63.0

                                                                                                         continued
   422   423   424   425   426   427   428   429   430   431   432