Page 470 -
P. 470

66    AMIT J. SHAH AND MICHAEL L. MONAHANAT


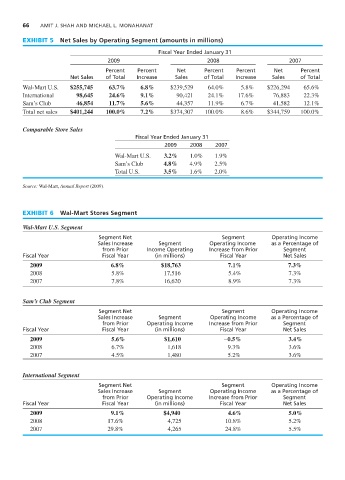
           EXHIBIT 5    Net Sales by Operating Segment (amounts in millions)
                                                        Fiscal Year Ended January 31
                                       2009                             2008                       2007
                                      Percent    Percent      Net      Percent   Percent      Net     Percent
                           Net Sales  of Total   Increase    Sales     of Total  Increase    Sales    of Total
           Wal-Mart U.S.   $255,745    63.7%      6.8%      $239,529    64.0%      5.8%    $226,294    65.6%
           International     98,645    24.6%      9.1%        90,421    24.1%     17.6%      76,883    22.3%
           Sam’s Club        46,854    11.7%      5.6%        44,357    11.9%      6.7%      41,582    12.1%
           Total net sales  $401,244  100.0%      7.2%      $374,307   100.0%      8.6%    $344,759   100.0%


           Comparable Store Sales
                                                Fiscal Year Ended January 31
                                                          2009    2008    2007
                                         Wal-Mart U.S.    3.2%    1.0%    1.9%
                                         Sam’s Club      4.8%     4.9%    2.5%
                                         Total U.S.      3.5%     1.6%    2.0%


           Source: Wal-Mart, Annual Report (2009).


           EXHIBIT 6    Wal-Mart Stores Segment

           Wal-Mart U.S. Segment
                                    Segment Net                              Segment         Operating Income
                                    Sales Increase      Segment         Operating Income     as a Percentage of
                                     from Prior     Income Operating    Increase from Prior      Segment
           Fiscal Year               Fiscal Year       (in millions)        Fiscal Year          Net Sales
              2009                      6.8%             $18,763               7.1%               7.3%
              2008                      5.8%              17,516               5.4%               7.3%
              2007                      7.8%              16,620               8.9%               7.3%


           Sam’s Club Segment
                                    Segment Net                              Segment         Operating Income
                                    Sales Increase      Segment          Operating Income    as a Percentage of
                                     from Prior     Operating Income    Increase from Prior      Segment
           Fiscal Year               Fiscal Year       (in millions)        Fiscal Year          Net Sales
              2009                      5.6%              $1,610             -0.5%                3.4%
              2008                      6.7%               1,618              9.3%                3.6%
              2007                      4.5%               1,480              5.2%                3.6%


           International Segment
                                    Segment Net                              Segment         Operating Income
                                    Sales Increase      Segment          Operating Income    as a Percentage of
                                     from Prior     Operating Income    Increase from Prior      Segment
           Fiscal Year               Fiscal Year       (in millions)        Fiscal Year          Net Sales
              2009                      9.1%             $4,940                4.6%               5.0%
              2008                     17.6%               4,725              10.8%               5.2%
              2007                     29.8%               4,265              24.8%               5.5%
   465   466   467   468   469   470   471   472   473   474   475