
Page 466 -
P. 466
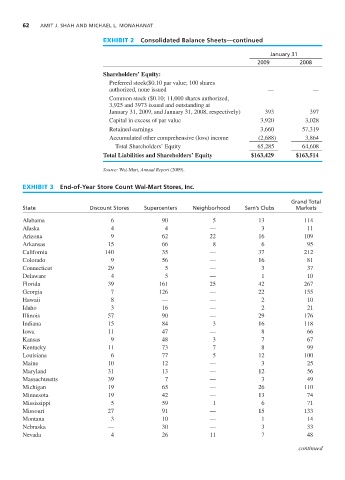
62    AMIT J. SHAH AND MICHAEL L. MONAHANAT


                                      EXHIBIT 2   Consolidated Balance Sheets—continued
                                                                                            January 31
                                                                                        2009          2008
                                      Shareholders’ Equity:
                                        Preferred stock($0.10 par value; 100 shares
                                        authorized, none issued                             —             —
                                        Common stock ($0.10; 11,000 shares authorized,
                                        3,925 and 3973 issued and outstanding at
                                        January 31, 2009, and January 31, 2008, respectively)  393       397
                                        Capital in excess of par value                   3,920          3,028
                                        Retained earnings                                3,660         57,319
                                        Accumulated other comprehensive (loss) income    (2,688)        3,864
                                          Total Shareholders’ Equity                    65,285         64,608
                                      Total Liabilities and Shareholders’ Equity      $163,429       $163,514

                                      Source: Wal-Mart, Annual Report (2009).


           EXHIBIT 3   End-of-Year Store Count Wal-Mart Stores, Inc.

                                                                                                   Grand Total
           State                 Discount Stores   Supercenters    Neighborhood     Sam’s Clubs      Markets
           Alabama                      6                90               5              13             114
           Alaska                       4                 4              —                3              11
           Arizona                      9                62              22              16             109
           Arkansas                    15                66               8               6             95
           California                 140                35              —               37             212
           Colorado                     9                56              —               16             81
           Connecticut                 29                 5              —                3             37
           Delaware                     4                 5              —                1              10
           Florida                     39               161              25              42             267
           Georgia                      7               126              —               22             155
           Hawaii                       8                —               —                2              10
           Idaho                        3                16              —                2             21
           Illinois                    57                90              —               29             176
           Indiana                     15                84               3              16            118
           Iowa                        11                47              —                8              66
           Kansas                       9                48               3               7              67
           Kentucky                    11                73               7               8             99
           Louisiana                    6                77               5              12             100
           Maine                       10                12              —                3             25
           Maryland                    31                13              —               12             56
           Massachusetts               39                 7              —                3              49
           Michigan                    19                65              —               26             110
           Minnesota                   19                42              —               13             74
           Mississippi                  5                59               1               6              71
           Missouri                    27                91              —               15            133
           Montana                      3                10              —                1             14
           Nebraska                    —                 30              —                3              33
           Nevada                       4                26              11               7              48

                                                                                                      continued