
Page 461 -
P. 461
CASE 5 • FAMILY DOLLAR STORES, INC. — 2009 57
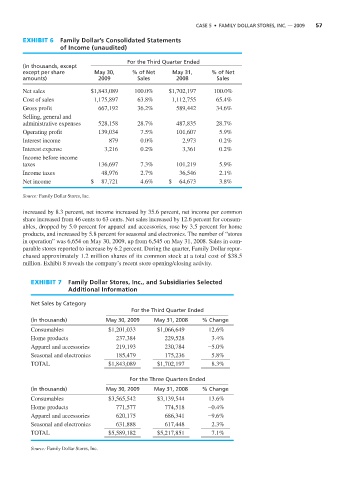
EXHIBIT 6 Family Dollar’s Consolidated Statements
of Income (unaudited)
For the Third Quarter Ended
(in thousands, except
except per share May 30, % of Net May 31, % of Net
amounts) 2009 Sales 2008 Sales
Net sales $1,843,089 100.0% $1,702,197 100.0%
Cost of sales 1,175,897 63.8% 1,112,755 65.4%
Gross profit 667,192 36.2% 589,442 34.6%
Selling, general and
administrative expenses 528,158 28.7% 487,835 28.7%
Operating profit 139,034 7.5% 101,607 5.9%
Interest income 879 0.0% 2,973 0.2%
Interest expense 3,216 0.2% 3,361 0.2%
Income before income
taxes 136,697 7.3% 101,219 5.9%
Income taxes 48,976 2.7% 36,546 2.1%
Net income $ 87,721 4.6% $ 64,673 3.8%
Source: Family Dollar Stores, Inc.
increased by 8.3 percent, net income increased by 35.6 percent, net income per common
share increased from 46 cents to 63 cents. Net sales increased by 12.6 percent for consum-
ables, dropped by 5.0 percent for apparel and accessories, rose by 3.5 percent for home
products, and increased by 5.8 percent for seasonal and electronics. The number of “stores
in operation” was 6,654 on May 30, 2009, up from 6,545 on May 31, 2008. Sales in com-
parable stores reported to increase by 6.2 percent. During the quarter, Family Dollar repur-
chased approximately 1.2 million shares of its common stock at a total cost of $38.5
million. Exhibit 8 reveals the company’s recent store opening/closing activity.
EXHIBIT 7 Family Dollar Stores, Inc., and Subsidiaries Selected
Additional Information
Net Sales by Category
For the Third Quarter Ended
(in thousands) May 30, 2009 May 31, 2008 % Change
Consumables $1,201,033 $1,066,649 12.6%
Home products 237,384 229,528 3.4%
Apparel and accessories 219,193 230,784 -5.0%
Seasonal and electronics 185,479 175,236 5.8%
TOTAL $1,843,089 $1,702,197 8.3%
For the Three Quarters Ended
(in thousands) May 30, 2009 May 31, 2008 % Change
Consumables $3,565,542 $3,139,544 13.6%
Home products 771,577 774,518 -0.4%
Apparel and accessories 620,175 686,341 -9.6%
Seasonal and electronics 631,888 617,448 2.3%
TOTAL $5,589,182 $5,217,851 7.1%
Source: Family Dollar Stores, Inc.