
Page 464 -
P. 464
60 AMIT J. SHAH AND MICHAEL L. MONAHANAT
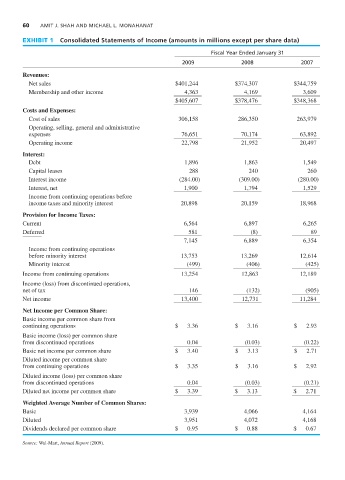
EXHIBIT 1 Consolidated Statements of Income (amounts in millions except per share data)
Fiscal Year Ended January 31
2009 2008 2007
Revenues:
Net sales $401,244 $374,307 $344,759
Membership and other income 4,363 4,169 3,609
$405,607 $378,476 $348,368
Costs and Expenses:
Cost of sales 306,158 286,350 263,979
Operating, selling, general and administrative
expenses 76,651 70,174 63,892
Operating income 22,798 21,952 20,497
Interest:
Debt 1,896 1,863 1,549
Capital leases 288 240 260
Interest income (284.00) (309.00) (280.00)
Interest, net 1,900 1,794 1,529
Income from continuing operations before
income taxes and minority interest 20,898 20,159 18,968
Provision for Income Taxes:
Current 6,564 6,897 6,265
Deferred 581 (8) 89
7,145 6,889 6,354
Income from continuing operations
before minority interest 13,753 13,269 12,614
Minority interest (499) (406) (425)
Income from continuing operations 13,254 12,863 12,189
Income (loss) from discontinued operations,
net of tax 146 (132) (905)
Net income 13,400 12,731 11,284
Net Income per Common Share:
Basic income per common share from
continuing operations $ 3.36 $ 3.16 $ 2.93
Basic income (loss) per common share
from discontinued operations 0.04 (0.03) (0.22)
Basic net income per common share $ 3.40 $ 3.13 $ 2.71
Diluted income per common share
from continuing operations $ 3.35 $ 3.16 $ 2.92
Diluted income (loss) per common share
from discontinued operations 0.04 (0.03) (0.21)
Diluted net income per common share $ 3.39 $ 3.13 $ 2.71
Weighted Average Number of Common Shares:
Basic 3,939 4,066 4,164
Diluted 3,951 4,072 4,168
Dividends declared per common share $ 0.95 $ 0.88 $ 0.67
Source: Wal-Mart, Annual Report (2009).