
Page 491 -
P. 491
CASE 8 • MACY’S, INC. — 2009 87
Macy’s recently launched a series of breakthrough brand ads featuring more than a
dozen design celebrities behind unique merchandise sold in their stores and online. These
celebrities ranged from Martha Stewart and Donald Trump to Usher, Jessica Simpson, Tyler
Florence, Sean Combs, and Kenneth Cole. The campaign ads, which depict the celebrities
interacting inside Macy’s, are planned to continue into the future with new faces and themes.
Financial Performance
Macy’s has adopted the following financial objectives:
• To accelerate comparable store sales growth.
• To continue to increase the company’s profitability levels (earnings before interest,
taxes, depreciation, and amortization) as a percentage of sales to a level of 14 percent
to 15 percent.
• To effectively use excess cash flow through a combination of strategic growth oppor-
tunities and stock buybacks.
• To grow earnings per share while increasing return on gross investment.
Macy’s financial performance in 2008 is provided in Exhibits 4 and 5.
Competitors
Macy’s considers Dillard’s, Inc., J.C. Penney Corporation, Inc., and Saks, Inc., to be its
closest competitors (see Exhibit 6). As compared with its closest competitors in 2008,
Macy’s 167,000 employees were considerably more than Dillard’s (33,433) and Saks’
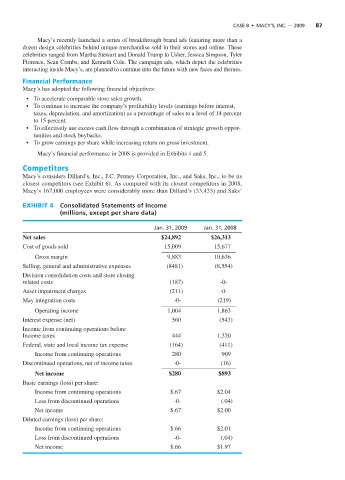
EXHIBIT 4 Consolidated Statements of Income
(millions, except per share data)
Jan. 31, 2009 Jan. 31, 2008
Net sales $24,892 $26,313
Cost of goods sold 15,009 15,677
Gross margin 9,883 10,636
Selling, general and administrative expenses (8481) (8,554)
Division consolidation costs and store closing
related costs (187) -0-
Asset impairment charges (211) -0-
May integration costs -0- (219)
Operating income 1,004 1,863
Interest expense (net) 560 (543)
Income from continuing operations before
Income taxes 444 1,320
Federal, state and local income tax expense (164) (411)
Income from continuing operations 280 909
Discontinued operations, net of income taxes -0- (16)
Net income $280 $893
Basic earnings (loss) per share:
Income from continuing operations $.67 $2.04
Loss from discontinued operations -0- (.04)
Net income $.67 $2.00
Diluted earnings (loss) per share:
Income from continuing operations $.66 $2.01
Loss from discontinued operations -0- (.04)
Net income $.66 $1.97