
Page 70 -
P. 70
36 PART 1 • OVERVIEW OF STRATEGIC MANAGEMENT
increase cutting into MCD’s gross margins as is evident from its income statement (Exhibit 8).
Total operating costs and expenses increased rose from about $16.5 billion in 2006 to $18.9 billion
in 2007. Foreign currency translation losses displayed in Exhibit 1 show the extent of damage that
global companies like MCD encounter due to the uncertainties in the global environment that no
one has control over. In February 2009, MCD cut prices of its popular menu items in China by as
much as 40 percent to reverse declining sales.
Conclusion
Success today is no guarantee for success tomorrow. However, McDonald’s added 40 restaurants in
India in 2008 and another 25 in 2009. Although people in India are predominantly Hindu and revere
the cow, thus eating no beef, they love McDonald’s, especially Chicken McNuggets, which were first
introduced in India in May 2009. MCD’s vegetable patties also are a big hit now in India.
For the second quarter, which ended June 30, 2009, MCD had positive global comparable sales in
every area of the world, as well as higher revenues, operating income, and earnings per share com-
pared with the prior year. “We’re driving results by staying focused on our global business strategy,
the Plan to Win,” said Chief Executive Officer Jim Skinner. “As consumers find themselves more
cash-strapped and time-challenged, they continue to count on McDonald’s for value, convenience,
and variety across our menu.” MCD’s second quarter 2009 results included global comparable sales
up 4.8% with the United States up 3.5%, Europe up 6.9%, and Asia/Pacific, Middle East and Africa
up 4.4% McDonald’s Europe delivered strong second quarter comparable sales led by performance in
the U.K., France, and Russia. In Asia/Pacific, Middle East, and Africa (APMEA), Australia led the
segment’s second quarter operating income increase of 34% in constant currencies.
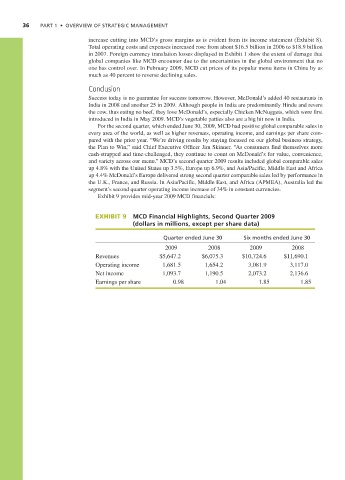
Exhibit 9 provides mid-year 2009 MCD financials:
EXHIBIT 9 MCD Financial Highlights, Second Quarter 2009
(dollars in millions, except per share data)
Quarter ended June 30 Six months ended June 30
2009 2008 2009 2008
Revenues $5,647.2 $6,075.3 $10,724.6 $11,690.1
Operating income 1,681.5 1,654.2 3,081.9 3,117.0
Net income 1,093.7 1,190.5 2,073.2 2,136.6
Earnings per share 0.98 1.04 1.85 1.85