Page 126 - Sustainability in the Process Industry Integration and Optimization
P. 126

P r o c e s s I n t e g r a t i o n f o r I m p r ov i n g E n e r g y E f f i c i e n c y   103


                                                                Natural Gas

                       Coal          Fuel Oil
                           Current: 250.0  Current: 55.4
                           [50.0; 250.0]   [40.0; 180.0]           GT
                                                       HRSG       18 MW
                      Boiler 1        Boiler 2                         Air
                                                Current: 208.4  Current: 28
                                                [115.0; 335.0]
                     Current: 105.0
                                                                  VHP (101 bar abs.)
                     [60.0; 165.0]
                     Current: 15.0  T4       Current: 59.5  T6    20.0
                     [15.0; 75.0]             [15.0; 65.0]   0.0
                                                                  HP (41 bar abs.)
                         Current: 90.0           Current: 40.9
                                      T5                          54.5
                         [30.0; 9.0]             [30.0; 70.0]  0.0
                                                                  MP (15 bar abs.)
                         0.0
                               Current: 20.0     Current: 108.0   55.9
                               [20.0; 20.0]  T7   [60.0; 150.0]  0.0
                                                                  LP (3 bar abs.)
                         LP Vent
                                          CW
                                   0.073 bar abs.  Current: 75.0  128.0
                                               [40.0; 75.0]
                     All flowrates are in [t/h]. The lower and upper bounds are shown in the format [min;max].
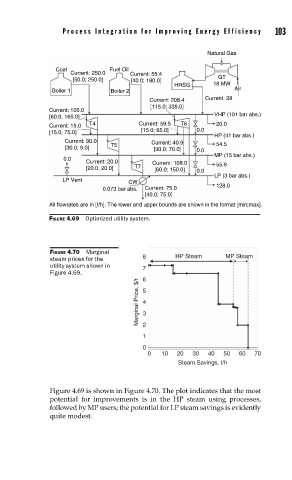
                     FIGURE 4.69  Optimized utility system.


                     FIGURE 4.70  Marginal
                     steam prices for the     8        HP Steam      MP Steam
                     utility system shown in   7
                     Figure 4.69.             6
                                             Marginal Price, $/t   5


                                              4
                                              3
                                              2
                                              1
                                              0
                                                0   10  20  30  40  50   60  70
                                                        Steam Savings, t/h


                     Figure 4.69 is shown in Figure 4.70. The plot indicates that the most
                     potential for improvements is in the HP steam using processes,
                     followed by MP users; the potential for LP steam savings is evidently
                     quite modest.
   121   122   123   124   125   126   127   128   129   130   131