
Page 167 - Sustainable Cities and Communities Design Handbook
P. 167
Sustainable Towns Chapter j 7 143
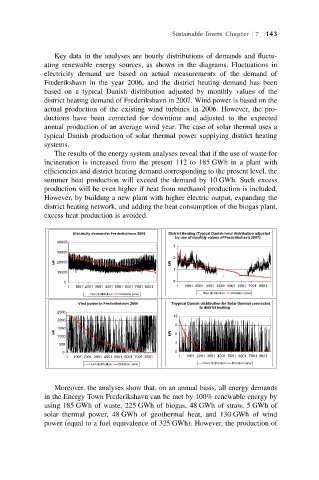
Key data in the analyses are hourly distributions of demands and fluctu-
ating renewable energy sources, as shown in the diagrams. Fluctuations in
electricity demand are based on actual measurements of the demand of
Frederikshavn in the year 2006, and the district heating demand has been
based on a typical Danish distribution adjusted by monthly values of the
district heating demand of Frederikshavn in 2007. Wind power is based on the
actual production of the existing wind turbines in 2006. However, the pro-
ductions have been corrected for downtime and adjusted to the expected
annual production of an average wind year. The case of solar thermal uses a
typical Danish production of solar thermal power supplying district heating
systems.
The results of the energy system analyses reveal that if the use of waste for
incineration is increased from the present 112 to 185 GWh in a plant with
efficiencies and district heating demand corresponding to the present level, the
summer heat production will exceed the demand by 10 GWh. Such excess
production will be even higher if heat from methanol production is included.
However, by building a new plant with higher electric output, expanding the
district heating network, and adding the heat consumption of the biogas plant,
excess heat production is avoided.
Electricity demand in Frederikshavn 2006 District Heating (Typical Danish hour distribution adjusted
by use of monthly values of Frederikshavn 2007)
40000
3
30000
2
kW 20000 kW
1
10000
0 0
1 1001 2001 3001 4001 5001 6001 7001 8001 1 1001 2001 3001 4001 5001 6001 7001 8001
Hour distribution Duration curve Hour distribution Duration curve
Vind power in Frederikshavn 2006 Thypical Danish distribution for Solar thermal connected
to district heating
2500
12
2000
9
1500
kW kW 6
1000
3
500
0 0
1 1001 2001 3001 4001 5001 6001 7001 8001 1 1001 2001 3001 4001 5001 6001 7001 8001
Hour distribution Duration curve Hour distribution Duration curve
Moreover, the analyses show that, on an annual basis, all energy demands
in the Energy Town Frederikshavn can be met by 100% renewable energy by
using 185 GWh of waste, 225 GWh of biogas, 48 GWh of straw, 5 GWh of
solar thermal power, 48 GWh of geothermal heat, and 130 GWh of wind
power (equal to a fuel equivalence of 325 GWh). However, the production of