
Page 178 - Sustainable Cities and Communities Design Handbook
P. 178
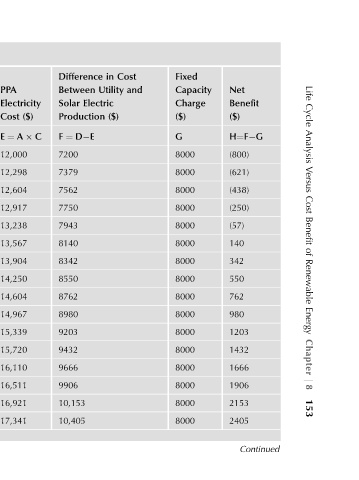
Life Cycle Analysis Versus Cost Benefit of Renewable Energy Chapter j 8 153


                  Net  Benefit  ($)  H¼F G  (800)  (621)  (438)  (250)  (57)  140  342  550  762  980  1203  1432  1666  1906  2153  2405  Continued


               Fixed  Capacity  Charge  ($)  G  8000  8000  8000  8000  8000  8000  8000  8000  8000  8000  8000  8000  8000  8000  8000  8000


               Cost  and

               in  Utility  Electric  ($)
               Difference  Between  Solar  Production  D E  ¼  F  7200  7379  7562  7750  7943  8140  8342  8550  8762  8980  9203  9432  9666  9906  10,153  10,405


                    Electricity  ($)  C     A

                  PPA  Cost  ¼  E  B  12,000  12,298  12,604  12,917  13,238  13,567  13,904  14,250  14,604  14,967  15,339  15,720  16,110  16,511  16,921  17,341


               Total  Utility  Electricity  ($)  Cost     ¼ A  D  19,200  19,677  20,166  20,667  21,181  21,707  22,247  22,799  23,366  23,947  24,542  25,152  25,777  26,417  27,074  27,746


               Solar  Electricity  Price

               PPA  Sale  ($/kWh)  C  0.075  0.077  0.080  0.082  0.084  0.087  0.090  0.092  0.095  0.098  0.101  0.104  0.107  0.110  0.113  0.117


            Comparison  Utility  Electricity  Cost  ($/kWh)  B  0.120  0.124  0.127  0.131  0.135  0.139  0.143  0.148  0.152  0.157  0.161  0.166  0.171  0.176  0.182  0.187


            Cost  Electricity  Produced  160,000  159,200  158,404  157,612  156,824  156,040  155,260  154,483  153,711  152,942  152,177  151,417  150,660  149,906  149,157  148,411
            8.2  Solar  (kWh)  A
            TABLE     Year   1  2   3  4  5  6  7   8  9  10  11  12  13  14  15  16