
Page 179 - Sustainable Cities and Communities Design Handbook
P. 179
154
H¼F G
Benefit
31,369
34,606
33,767
32,149
32,948
2663
3478
3200
2928
Net
($)
Capacity
Charge
8000
8000
8000
8000
($)
G
0
0
0
0
0
and
Utility
($)
Electric
Production
Between
D E
32,948
31,369
33,767
11,200
32,149
10,663
11,478
34,606
10,928
Solar
¼
F
C
Electricity
($)
19,131
18,667
18,214
17,772
A
Cost
PPA
¼
0
E
0
0
0
0
B
Electricity
($)
33,767
32,948
32,149
29,142
29,867
34,606
28,436
31,369
30,609
¼ A
Utility
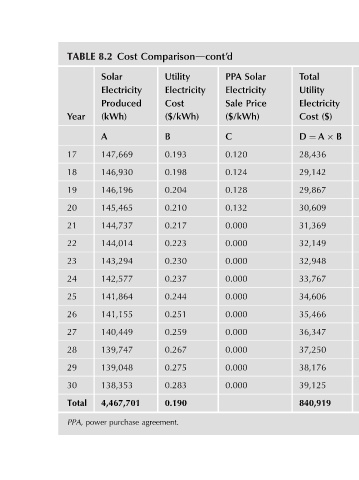
Total Fixed Cost in Difference Sustainable Cities and Communities Design Handbook 35,466 0 35,466 0 35,466 36,347 0 36,347 0 36,347 37,250 0 37,250 0 37,250 38,176 0 38,176 0 38,176 39,125 0 39,125 0 39,125 374,846 160,000 534,846 306,073 840,919
Cost
D
Solar Electricity Price
PPA Sale ($/kWh) C 0.120 0.124 0.128 0.132 0.000 0.000 0.000 0.000 0.000 0.000 0.000 0.000 0.000 0.000
Comparisondcont’d Utility Electricity Cost ($/kWh) B 0.193 0.198 0.204 0.210 0.217 0.223 0.230 0.237 0.244 0.251 0.259 0.267 0.275 0.283 0.190 agreement.
Cost Electricity Produced 147,669 146,930 146,196 145,465 144,737 144,014 143,294 142,577 141,864 141,155 140,449 139,747 139,048 138,353 4,467,701 purchase
8.2 Solar (kWh) A power
TABLE Year 17 18 19 20 21 22 23 24 25 26 27 28 29 30 Total PPA,