
Page 181 - Sustainable Cities and Communities Design Handbook
P. 181
Life Cycle Analysis Versus Cost Benefit of Renewable Energy Chapter j 8 155
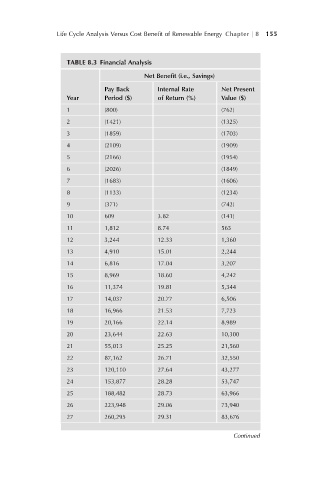
TABLE 8.3 Financial Analysis
Net Benefit (i.e., Savings)
Pay Back Internal Rate Net Present
Year Period ($) of Return (%) Value ($)
1 (800) (762)
2 (1421) (1325)
3 (1859) (1703)
4 (2109) (1909)
5 (2166) (1954)
6 (2026) (1849)
7 (1683) (1606)
8 (1133) (1234)
9 (371) (742)
10 609 3.82 (141)
11 1,812 8.74 563
12 3,244 12.33 1,360
13 4,910 15.01 2,244
14 6,816 17.04 3,207
15 8,969 18.60 4,242
16 11,374 19.81 5,344
17 14,037 20.77 6,506
18 16,966 21.53 7,723
19 20,166 22.14 8,989
20 23,644 22.63 10,300
21 55,013 25.25 21,560
22 87,162 26.71 32,550
23 120,110 27.64 43,277
24 153,877 28.28 53,747
25 188,482 28.73 63,966
26 223,948 29.06 73,940
27 260,295 29.31 83,676
Continued