
Page 318 - Sustainable Cities and Communities Design Handbook
P. 318
Mauritius Island Nation Chapter j 15 291
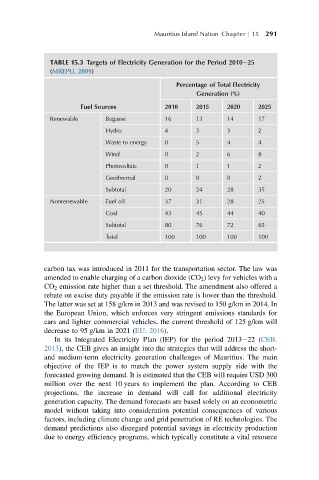
TABLE 15.3 Targets of Electricity Generation for the Period 2010e25
(MREPU, 2009)
Percentage of Total Electricity
Generation (%)
Fuel Sources 2010 2015 2020 2025
Renewable Bagasse 16 13 14 17
Hydro 4 3 3 2
Waste to energy 0 5 4 4
Wind 0 2 6 8
Photovoltaic 0 1 1 2
Geothermal 0 0 0 2
Subtotal 20 24 28 35
Nonrenewable Fuel oil 37 31 28 25
Coal 43 45 44 40
Subtotal 80 76 72 65
Total 100 100 100 100
carbon tax was introduced in 2011 for the transportation sector. The law was
amended to enable charging of a carbon dioxide (CO 2 ) levy for vehicles with a
CO 2 emission rate higher than a set threshold. The amendment also offered a
rebate on excise duty payable if the emission rate is lower than the threshold.
The latter was set at 158 g/km in 2013 and was revised to 150 g/km in 2014. In
the European Union, which enforces very stringent emissions standards for
cars and lighter commercial vehicles, the current threshold of 125 g/km will
decrease to 95 g/km in 2021 (EU, 2016).
In its Integrated Electricity Plan (IEP) for the period 2013e22 (CEB,
2013), the CEB gives an insight into the strategies that will address the short-
and medium-term electricity generation challenges of Mauritius. The main
objective of the IEP is to match the power system supply side with the
forecasted growing demand. It is estimated that the CEB will require USD 300
million over the next 10 years to implement the plan. According to CEB
projections, the increase in demand will call for additional electricity
generation capacity. The demand forecasts are based solely on an econometric
model without taking into consideration potential consequences of various
factors, including climate change and grid penetration of RE technologies. The
demand predictions also disregard potential savings in electricity production
due to energy efficiency programs, which typically constitute a vital resource