
Page 317 - Sustainable Cities and Communities Design Handbook
P. 317
290 Sustainable Cities and Communities Design Handbook
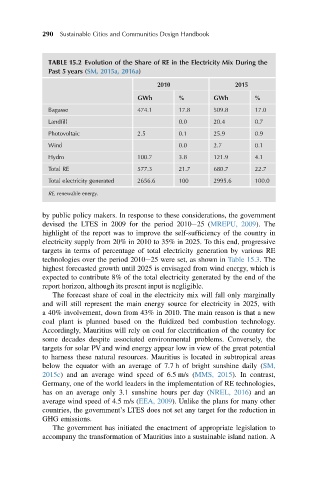
TABLE 15.2 Evolution of the Share of RE in the Electricity Mix During the
Past 5 years (SM, 2015a, 2016a)
2010 2015
GWh % GWh %
Bagasse 474.1 17.8 509.8 17.0
Landfill 0.0 20.4 0.7
Photovoltaic 2.5 0.1 25.9 0.9
Wind 0.0 2.7 0.1
Hydro 100.7 3.8 121.9 4.1
Total RE 577.3 21.7 680.7 22.7
Total electricity generated 2656.6 100 2995.6 100.0
RE, renewable energy.
by public policy makers. In response to these considerations, the government
devised the LTES in 2009 for the period 2010e25 (MREPU, 2009). The
highlight of the report was to improve the self-sufficiency of the country in
electricity supply from 20% in 2010 to 35% in 2025. To this end, progressive
targets in terms of percentage of total electricity generation by various RE
technologies over the period 2010e25 were set, as shown in Table 15.3. The
highest forecasted growth until 2025 is envisaged from wind energy, which is
expected to contribute 8% of the total electricity generated by the end of the
report horizon, although its present input is negligible.
The forecast share of coal in the electricity mix will fall only marginally
and will still represent the main energy source for electricity in 2025, with
a 40% involvement, down from 43% in 2010. The main reason is that a new
coal plant is planned based on the fluidized bed combustion technology.
Accordingly, Mauritius will rely on coal for electrification of the country for
some decades despite associated environmental problems. Conversely, the
targets for solar PV and wind energy appear low in view of the great potential
to harness these natural resources. Mauritius is located in subtropical areas
below the equator with an average of 7.7 h of bright sunshine daily (SM,
2015c) and an average wind speed of 6.5 m/s (MMS, 2015). In contrast,
Germany, one of the world leaders in the implementation of RE technologies,
has on an average only 3.1 sunshine hours per day (NREL, 2016) and an
average wind speed of 4.5 m/s (EEA, 2009). Unlike the plans for many other
countries, the government’s LTES does not set any target for the reduction in
GHG emissions.
The government has initiated the enactment of appropriate legislation to
accompany the transformation of Mauritius into a sustainable island nation. A