
Page 407 - Sustainable On-Site CHP Systems Design, Construction, and Operations
P. 407
380 Ca s e S t u d y 5
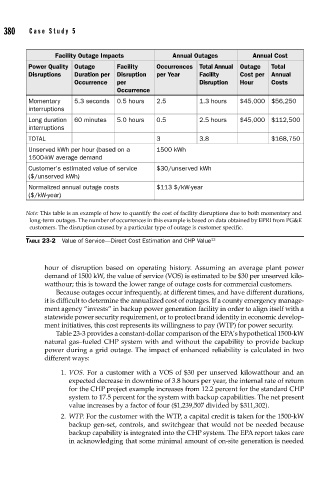
Facility Outage Impacts Annual Outages Annual Cost
Power Quality Outage Facility Occurrences Total Annual Outage Total
Disruptions Duration per Disruption per Year Facility Cost per Annual
Occurrence per Disruption Hour Costs
Occurrence
Momentary 5.3 seconds 0.5 hours 2.5 1.3 hours $45,000 $56,250
interruptions
Long duration 60 minutes 5.0 hours 0.5 2.5 hours $45,000 $112,500
interruptions
TOTAL 3 3.8 $168,750
Unserved kWh per hour (based on a 1500 kWh
1500-kW average demand
Customer’s estimated value of service $30/unserved kWh
($/unserved kWh)
Normalized annual outage costs $113 $/kW-year
($/kW-year)
Note: This table is an example of how to quantify the cost of facility disruptions due to both momentary and
long-term outages. The number of occurrences in this example is based on data obtained by EPRI from PG&E
customers. The disruption caused by a particular type of outage is customer specific.
TABLE 23-2 Value of Service—Direct Cost Estimation and CHP Value 12
hour of disruption based on operating history. Assuming an average plant power
demand of 1500 kW, the value of service (VOS) is estimated to be $30 per unserved kilo-
watthour; this is toward the lower range of outage costs for commercial customers.
Because outages occur infrequently, at different times, and have different durations,
it is difficult to determine the annualized cost of outages. If a county emergency manage-
ment agency “invests” in backup power generation facility in order to align itself with a
statewide power security requirement, or to protect brand identity in economic develop-
ment initiatives, this cost represents its willingness to pay (WTP) for power security.
Table 23-3 provides a constant-dollar comparison of the EPA’s hypothetical 1500-kW
natural gas–fueled CHP system with and without the capability to provide backup
power during a grid outage. The impact of enhanced reliability is calculated in two
different ways:
1. VOS. For a customer with a VOS of $30 per unserved kilowatthour and an
expected decrease in downtime of 3.8 hours per year, the internal rate of return
for the CHP project example increases from 12.2 percent for the standard CHP
system to 17.5 percent for the system with backup capabilities. The net present
value increases by a factor of four ($1,239,507 divided by $311,302).
2. WTP. For the customer with the WTP, a capital credit is taken for the 1500-kW
backup gen-set, controls, and switchgear that would not be needed because
backup capability is integrated into the CHP system. The EPA report takes care
in acknowledging that some minimal amount of on-site generation is needed