
Page 408 - Sustainable On-Site CHP Systems Design, Construction, and Operations
P. 408
Governmental Facility—Mission Critical 381
Value of Service (VOS) Willingness to Pay
CHP with Backup— (WTP) CHP with
CHP System Standard CHP Direct Cost with Steam Backup—Avoided Cost
Components (No Backup) Generator of Diesel Generator
Generator capacity (kW) 1,500 1,500 1,500
CHP system installed 1,800 1,800 1,800
cost ($/kW)
Added controls & N/A 175 175
switchgear cost ($/kW)
Typical backup gen-set, N/A Not valued directly (550)
controls & switchgear
($/kW)
Total CHP system 1,800 1,975 1,425
capital cost ($/kW)
Total CHP system 2,700,000 2,962,500 2,137,500
capital cost ($)
Net annual energy 400,000 400,000 400,000
savings ($)
Decrease in annual 0 3.8 Not valued directly
outage time (hours/year)
Customer value of N/A 113 Not valued directly
service ($/kW-year)
Annual decrease in N/A 168,750 Not valued directly
outage costs ($)
Total annual savings ($) 400,000 568,750 400,000
Payback (years) 6.8 5.2 5.3
Internal rate of return (%) 12.20 17.50 16.90
Net present value (at $311,302 1,239,507 822,665
10% discount) ($)
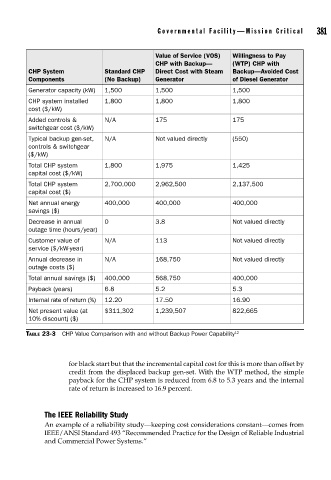
TABLE 23-3 CHP Value Comparison with and without Backup Power Capability 12
for black start but that the incremental capital cost for this is more than offset by
credit from the displaced backup gen-set. With the WTP method, the simple
payback for the CHP system is reduced from 6.8 to 5.3 years and the internal
rate of return is increased to 16.9 percent.
The IEEE Reliability Study
An example of a reliability study—keeping cost considerations constant—comes from
IEEE/ANSI Standard 493 “Recommended Practice for the Design of Reliable Industrial
and Commercial Power Systems.”