
Page 101 -
P. 101
86 DUBINSKY, HAZZAN, TALBY, AND KEREN
Table 6.2
Average Ratio of Measures Between Plan-Driven and Agile Project
(July–September 2005)
Test steps per keyword-based complexity 2.1
Test steps per logic-based complexity 2.5
Test scenarios per keyword-based complexity 2.9
Test scenarios per logic-based complexity 3.5
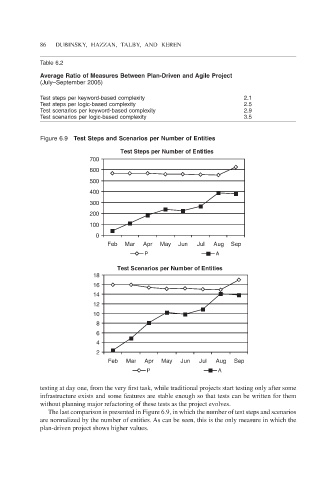
Figure 6.9 Test Steps and Scenarios per Number of Entities
Test Steps per Number of Entities
700
600
500
400
300
200
100
0
Feb Mar Apr May Jun Jul Aug Sep
P A
Test Scenarios per Number of Entities
18
16
14
12
10
8
6
4
2
Feb Mar Apr May Jun Jul Aug Sep
P A
testing at day one, from the very first task, while traditional projects start testing only after some
infrastructure exists and some features are stable enough so that tests can be written for them
without planning major refactoring of these tests as the project evolves.
The last comparison is presented in Figure 6.9, in which the number of test steps and scenarios
are normalized by the number of entities. As can be seen, this is the only measure in which the
plan-driven project shows higher values.