
Page 98 -
P. 98
TRANSITION TO AGILE SOFTWARE DEVELOPMENT IN A LARGE-SCALE PROJECT 83
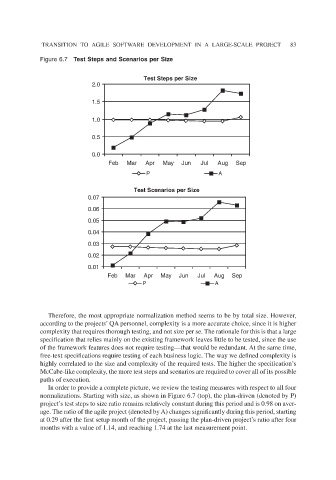
Figure 6.7 Test Steps and Scenarios per Size
Test Steps per Size
2.0
1.5
1.0
0.5
0.0
Feb Mar Apr May Jun Jul Aug Sep
P A
Test Scenarios per Size
0.07
0.06
0.05
0.04
0.03
0.02
0.01
Feb Mar Apr May Jun Jul Aug Sep
P A
Therefore, the most appropriate normalization method seems to be by total size. However,
according to the projects’ QA personnel, complexity is a more accurate choice, since it is higher
complexity that requires thorough testing, and not size per se. The rationale for this is that a large
specification that relies mainly on the existing framework leaves little to be tested, since the use
of the framework features does not require testing—that would be redundant. At the same time,
free-text specifications require testing of each business logic. The way we defined complexity is
highly correlated to the size and complexity of the required tests. The higher the specification’s
McCabe-like complexity, the more test steps and scenarios are required to cover all of its possible
paths of execution.
In order to provide a complete picture, we review the testing measures with respect to all four
normalizations. Starting with size, as shown in Figure 6.7 (top), the plan-driven (denoted by P)
project’s test steps to size ratio remains relatively constant during this period and is 0.98 on aver-
age. The ratio of the agile project (denoted by A) changes significantly during this period, starting
at 0.29 after the first setup month of the project, passing the plan-driven project’s ratio after four
months with a value of 1.14, and reaching 1.74 at the last measurement point.