
Page 97 -
P. 97
82 DUBINSKY, HAZZAN, TALBY, AND KEREN
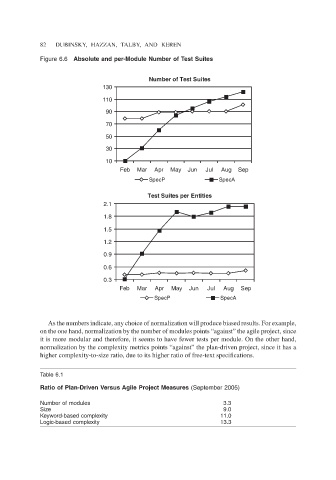
Figure 6.6 Absolute and per-Module Number of Test Suites
Number of Test Suites
130
110
90
70
50
30
10
Feb Mar Apr May Jun Jul Aug Sep
SpecP SpecA
Test Suites per Entities
2.1
1.8
1.5
1.2
0.9
0.6
0.3
Feb Mar Apr May Jun Jul Aug Sep
SpecP SpecA
As the numbers indicate, any choice of normalization will produce biased results. For example,
on the one hand, normalization by the number of modules points “against” the agile project, since
it is more modular and therefore, it seems to have fewer tests per module. On the other hand,
normalization by the complexity metrics points “against” the plan-driven project, since it has a
higher complexity-to-size ratio, due to its higher ratio of free-text specifications.
Table 6.1
Ratio of Plan-Driven Versus Agile Project Measures (September 2005)
Number of modules 3.3
Size 9.0
Keyword-based complexity 11.0
Logic-based complexity 13.3